How is Google’s mobile revenue rising if 50% of people do zero searches per day?


Ooh look, an ad on a mobile search. Photo by patientpowerful on Flickr.

If, on average, people do less than one search per day on mobile, then how is it that Google keeps reporting that mobile search is bringing in more money?

Isn’t that a refutation of what I said last October, when I said that it was a “growing problem” that 50% of people do zero searches per day on mobile?

Wall Street analysts are interested in this question, because they can see which way the wind’s blowing – towards mobile, away from desktop, where searches in developed countries are likely tailing away in total number. (They certainly are in the US.) If mobile is growing, and fewer people do searches, and Google depends on searches.. isn’t that bad?

But Google says everything’s rosy. Until you examine it more closely.

Here’s Ruth Porat, Google’s chief financial officer, on the Q1 2016 Google earnings discussion and Q+A transcript (from the ever-wonderful SeekingAlpha):

“Our very strong revenue of $20.3bn in Q1… [was] up 23% in constant currency versus last year. The primary driver was the use of Mobile Search by consumers, benefiting from our ongoing efforts to enhance the Mobile Search experience.”

And that’s not all:

“we also benefited from solid growth in desktop and tablet search as well as continued strength in YouTube and programmatic advertising.” Porat also says later (in the Q+A); “mobile search revenue was up considerably”.

So everything’s great. Although Wall St sold off the shares, on the basis that mobile ads weren’t converting well. Huh? Wall St has it wrong, surely?

Porat commented that

“our strongest growth areas, namely mobile and programmatic, carry higher TAC [traffic acquisition costs – when you have to pay someone to bring the traffic to you; an example is the default search on Apple’s desktop and mobile Safari. Google pays Apple a fixed amount, and – it’s reckoned – a per-search amount.]

So how is mobile search bringing in more money? Simple: Google has stuffed more ads into view. On mobile search, you now have to scroll the page before you see an organic search result.

This was brought up in the questions. Carlos Kirjner-Neto of Sanford Bernstein asked Sundar Pichai:

“can you talk a bit about the decision you took last year to have an additional ad on Mobile Search response pages relegating organic results below the fold? How is it good for the user experience to have [an] ad instead of organic? And if it is good, what does it say about the potential for innovation in organic search?”

Pichai’s response:

“We are incredibly sensitive to the user experience on Search. And so we are constantly evolving how we display ads, but we take a very long-term view. Our ads quality efforts [sic], these are people who have been working on this for many, many years and they are squarely focused on optimizing for positive metrics across users and advertisers. So our utmost focus is making sure, for users, these changes have a positive impact. And mobile is an entirely different paradigm and so a lot of things are counter-intuitive. So, for example, users are very comfortable swiping on mobile. So we deeply think about these things, and I’m very comfortable about how we are planning this for the very long term.”

“Users are very comfortable swiping on mobile.” Uh-huh. Though notice that it’s the advert that comes above the organic results. Presumably Google and advertisers wouldn’t be happy at people getting the organic results first and having to swipe to find the ads. Another analyst brought this up too. Justin Post, of Bank of America Merrill Lynch, asked:

“can you help us on query growth, just how that’s trending since Mobile really took off? Is it growing? How is it trending? And do you have more room to monetize, given where your ad coverage is now?”

This is a crucial question. What Post is asking is: do people actually do more searching on mobile? And is the number who do searches growing? (They’re precisely the questions I’d ask if I were on the call, so 👏 to Post.) Will Pichai, the search engine’s boss, answer this? No, it’s Ruth Porat stepping up to the mic.

“On query growth, we don’t really talk about query growth,”

she replies.

Oh.

“As Sundar said, [we’re] focused on answers’ there are a lot of new ways to search on mobile, of course, voice, et cetera. So let me try and actually add a little more on your question on cloud.”

(Post had asked a two-part question, part of which was to do with Google’s for-hire cloud business.)

The pattern keeps being repeated. Analysts try to ask questions to winkle some sort of insight into where mobile search is going; Porat and Pichai duck and dive.

Here’s Brian Nowak of Morgan Stanley:

“Just on Mobile Search and the mobile ad format changes in 3Q of last year… were those changes made globally last year in 3Q?… And then on the desktop, Ruth [Porat], you mentioned that desktop [revenue] growth picked up in the first quarter. What drove that pickup in growth, and [are there] any learnings from the change in the right-hand rail in the first quarter?”

Here, Nowak is first asking about the ad changes on mobile which added another ad. On the desktop, he’s asking another deeply relevant question. Desktop search is slowing down in developing markets, because people spend less time on desktops, more on smartphones.

So earlier this year, Google changed the layout of its desktop results so that there’s no “right-hand rail” of adverts. Instead, all the adverts are piled at the top of the page, followed by the “OneBox” promoting Google services (such as Maps, YouTube, and News).

For “highly commercial” queries (a definition Google isn’t sharing), you’ll get four rather than three ads on top of the results. And who knows, over time perhaps more and more queries that qualify for ads will be defined as “highly commercial”?

As on mobile, the result is that you now have to scroll some distance to get to organic search results on many queries. (If you think this is somehow new, not at all; in 2013 Danny Sullivan was asking “Are Google’s results getting too ad-heavy and self-promotional?”.)

So what happens? Is it possible that people impatiently click on an ad when they see something that looks like an answer? Nowak might be implying that it’s simply this which has driven up desktop revenue; analysts aren’t stupid.

Pichai confirms that the mobile change was global. But then, instead of the head of the search company handling the question about “learnings” from the change in desktop layout, it goes to the finance person, Porat. Here’s what she told Nowak:

“We had a modest benefit from that change where, just to be clear for all, we reduced the ad load by removing ads on the right-hand side of the screen while adding a fourth ad slot for highly commercial queries in the aggregate. That results in a cleaner, more useful, presentation and improved user experience. It was a modest impact, but additive.”

At this point one has to raise a hand. First, Google wouldn’t have made that change if it meant fewer clicks on ads. But how – how? – can having more ads piled on top of the organic results be an “improved user experience”? If the ads are better for the user than the organic results, then why have organic results at all? (Nowak seems to be hinting at this too. All ads would mean Google would absolutely coin it.) If the change means you have to scroll further to get to unpaid results, how is that better? I really don’t get it.

So what are we left with?
• Google stolidly refuses to tell us what’s happening with trends in search on mobile
• there are more ads above the results on both mobile and desktop than a year ago
• Google is getting more revenue, in total from adverts on both mobile and desktop
• Google insists that the addition of adverts above the results on the desktop results in an “improved user experience”
• happily, this improved user experience also results in improved revenues for Google.

Me – well, I’m still fascinated by where this will end up. Can Google just keep adding ads above the results without end, as Morgan Stanley’s Nowak possibly implied, and keep pumping up the revenues from desktop and mobile? If so, how does that square with Google’s long-ago disdain for search engines which put adverts ahead of organic results?

Just in case you want me to SaveYouAClick, the link text there says:

Since it is very difficult even for experts to evaluate search engines, search engine bias is particularly insidious. A good example was OpenText, which was reported to be selling companies the right to be listed at the top of the search results for particular queries [Marchiori 97].… In general, it could be argued from the consumer point of view that the better the search engine is, the fewer advertisements will be needed for the consumer to find what they want.

Those words are nearly 20 years old. But they’re still true.

Android Wear activations might hit 5 million by October… if things go well

It seems buyers aren’t either. Photo by jonmasters on Flickr.

It was early November when I last looked at how Android Wear was faring. According to my methodology, at that time there had been 2.74m Android Wear devices activated. (That post also explains my methodology, so I won’t repeat it.)

I’d expected that the Christmas period would see a dramatic rise in that figure; traditionally it’s the time for gifts, even (or especially) for the geek in your life, so I thought that there would be a rapid uptick in the number of Android Wear downloads, each new one of which indicates an activated device.

And yet. The download figure for Android Wear remains stubbornly stuck in the “1m – 5m” band, which it crossed into in mid-February 2015.

Patience

Twelve months on, and what has happened in the meantime? Apple launched the Apple Watch, which various estimates reckon shipped 4m units in its first quarter (April-June 2015) alone, and then topped it off with slightly better quarters each time.

And Android Wear? My latest calculation puts the number activated at between 3.35m and 3.45m – see the graph below. (The variation arises from whether you assume that comments proceed strictly in line with downloads, or that people are less likely to comment as time goes on.)

Is that bad? Well, since the start of the year, it has been adding activations at around 40,500 per week. In the four weeks before the New Year, it was 46,000 per week, with one particularly notably peak in a mid-November week of nearly 79,000.

You’d expect that: big rush before Christmas, slowdown afterwards. But at that rate, it’s going to take a long time for the ticker to go past 5 million on Google Play. In my November post, I thought we’d already be there now.

How reasonable is my estimate? We can definitely say that it has taken more than a year to rack up fewer than 4m activations – which makes sense, because to add 4m takes a consistent run rate of nearly 77,000 activations per week. Android Wear appears to be nowhere near that.

According to my calculations, at the present activation rate, it will take until October before total Android Wear activations pass the 5m mark.

Android Wear activations are well short of 5 million

Android Wear estimated activations: presently just short of 3.5m, and with a long road ahead

So what’s wrong with Android Wear?

There’s no shortage of Android Wear devices. They were ahead of Apple in introducing the concept of the “smart watch”. They were ahead of Apple in arriving: LG, Motorola, Huawei, pretty much every big Android OEM except Samsung and HTC got in there. Samsung isn’t there because it prefers its own Tizen OS – because that allows the flexibility to do what it wants. HTC backed off the idea, which was smart given the financial problems it has. Google has introduced an app to make them work with iOS. Hasn’t changed things.

If people aren’t buying these devices, there’s a problem in the story around them. “Why would I want a smartwatch? For that price? And look at how BIG it is!” (The latter is a pretty consistent reaction to the giant wheels people are expected to strap on their wrist. Actually, maybe that’s our answer.)

Given the gigantic addressable market for Android Wear – pretty much every Android user, which is a lot of people – it seems like we’re seeing both the “premium effect” (iPhone users tend to spend more) and the “huh? Why?” effect.

Quite possibly smartwatches are going to remain a niche – a sort of technological diversion, a bit like games consoles, which have a devoted and upgrading audience, but aren’t actually that pervasive when you look closely at the numbers (particularly when you note how many buyers of one console then add another).

One thing’s for sure, though – the makers of Android Wear devices need a good selling line, and soon.

The Q4 2015 smartphone scorecard: Apple gazes down at the rat trap

Seen Skyfall? Remember the scene when we first encounter Javier Bardem playing whoever the baddie is? Here it is, as a reminder:

Bear it in mind. We’ll come back to it.

So: Ben Bajarin had some pretty bleak news for top-end Android smartphone companies recently:

That’s a decline of 90m, even while the overall smartphone market has grown from 704m (of which 501m were Android) to 1.43bn (of which 1.16bn were Android).

But your objection is probably the same as mine: isn’t the decrease in those sur-$500 shipments because the price of high-end Android handsets has fallen? The price you have to pay to get something with the same qualities as the $500-or-more Android flagship is lower than it was in 2012.

This is almost certainly true – but it isn’t much compensation for those struggling to expand their sales and seeing average selling prices (ASPs) fall. There’s a simple financial reason: if you keep selling the same number of phones at lower ASP, your profit will inevitably fall off a cliff as fixed costs such as staff and administration weigh you down.

What’s also notable that Apple hasn’t – so far – been affected by any drop in ASP. Since the start of 2010, its ASP for any quarter has only been below $600 four times – and in the most recent quarter, it reached an all-time high. Which leads one to wonder: what the hell is going on? But let’s show you the numbers from the quarter, and then discuss them.

Q4 2015: the smartphone scorecard
* denotes estimate: explanations below
Company Handsets
(million)
Revenues Handset
ASP
Operating
profit
Per-handset
profit
Samsung 81.5 $20.40bn $225.39 $1.90bn $23.29
Apple 78.25 $51.64bn $690.50 $14.41bn* $184.10*
LG 15.3 $3.22bn $210.26 –$51.47m –$3.36
Sony 7.6 $3.20bn $421.58 $198.91m $26.17
HTC 3.4* $0.81bn $237.05 –$128.00m –$37.65
Microsoft
Mobile
4.5 $0.84bn $185.70 –$162m –$36.11

Assumptions

Samsung: featurephones (it sold 18.5m) had an ASP of $30, and generated zero profit; its tablets had an ASP of $100 and generated zero profit. (These are the same assumptions as in previous quarters. If the ASP is lower, then revenues are higher and the ASP of smartphones is higher; if profits are non-zero on tablets and featurephones, profits on smartphones are lower.)

Apple: operating profit has to be assumed, at the same 27.9% share of revenue as in previous quarters. This may not be true – new phones such as the 6S/Plus are more expensive to produce at the start of a cycle (such as now). But again, consistency probably helps give the broad picture rather than trying to dive into numbers that only a few people inside Apple truly know.

Microsoft Mobile: assumes, as previously, that featurephones (there were 22.5m of them) had an ASP of $15 and gross margin – the profit purely on the goods, not including costs such as R+D and administration etc – of $5. These are the same assumptions as in the past. I’ve chopped the estimates of R+D and administration cost from $200m in previous quarters to $100m and from $300m to $100m because Microsoft said in its 10-Q that

Operating expenses [in the Devices division, which makes the Surface Pro, Surface Book, and phones] decreased $561m or 14%, mainly due to lower sales and marketing expenses and research and development expenses. Sales and marketing expenses decreased $359m or 18%, driven by a reduction in phone expenses, partially offset by marketing expenses associated with the launch of Surface Pro 4, Surface Book, and Windows 10. Research and development expenses decreased $179m or 11%, mainly due to a reduction in phone expenses.

To reach my figure for Microsoft’s profitability (or lack of it) I’ve taken $300m out of the Microsoft phone group’s operating costs, which might be close to the amount from the total $920m it says it cut. Without more clarity (or a shutdown of the phones division), hard to tell. But there’s no way one can see a division which sells 4.5m phones and generates around $830m being profitable; that’s about the same scale as HTC, which we know is not profitable because it publishes its results.

Microsoft has become increasingly opaque about the profitability of its phone side (though of course Apple has never declared any numbers there; one has to back it out from what is known about Mac and iPod profitability).

Where’s Android Wear?

You may ask yourself: where are Android Wear shipments as a factor in the revenues of LG, Sony or Lenovo (or Samsung’s Gear in its figures)? To which I’ll answer: don’t worry. Too small to trouble with. By my calculations, and those of other analysts, Android Wear shipments from all makers in Q4 totalled 0.9m. At around $150 each, that’s a rounding error in revenue for any of these players. (I’ll revisit my ongoing calculations on Android Wear usage figures in the near future.)

Handset pricing: Apple stands on the precipice

The real lessons of what’s going one here aren’t easy to see from a single quarter’s numbers. But if you want it in a single statistic, look at the contrast between Sony and LG. LG sold nearly twice as many phones, but Sony made a respectable profit, while LG made a loss. What’s the difference between them? ASP. Sony’s phones sold at an average price of $421.58, while LG’s were half that – $210.26. (This doesn’t mean that every LG phone sold at that price, or every Sony phone. But it tells you that Sony must have sold a lot more expensive phones than LG.)

Graph the trend in ASP and it becomes clearer: Sony has (as it said it intended to) driven up ASP, while LG has been pushed down.

Sony phone ASPs are up, LG's are flat or down

Sony’s overall phone ASP has risen (though it now only sells half as many phones as LG)

Sony is literally the only Android OEM which has managed to raise ASPs consistently over the past year, and after a lot of pain (in the form of losses) it seems to be paying off in the form of profit. There’s a simple reason why, of course. The higher the price you can sell something for, the lower the proportion of your revenues the fixed costs – sales, administration, staff, and even seemingly trivial things like patent licensing – become. If you can drive your price up, you begin making profit. But if your ASP is driven down, everything starts eating into the bottom line.

Sony’s problem though is that it’s shrinking year-on-year. After a while, if your shipments are too low then even a high ASP can’t save you from your fixed costs – see HTC for the example. Still, Sony stands alone as having the highest ASP among Android OEMs. That doesn’t mean it sells the largest number of pricey handsets (Samsung surely has that title) but that it is consistently high.

Note how it’s only Samsung, which has both chip foundries and screen fabrication facilities, that has consistently been the biggest smartphone OEM and the only consistently profitable Android OEM.

But Samsung’s ASP is coming down quarter after quarter; it’s only keeping its profits level by making more phones, whose ASPs are falling. That hits revenues and profits – as charted below.

Samsung mobile revenues, profits and ASPs are falling

Note also how the total number of handsets that Samsung, HTC, Sony, LG and Lenovo/Motorola sold in 4Q15 was down to 128m, compared to 133.15m a year before – a fall of 4% while the smartphone business as a whole grew 6%. There’s a growing squeeze on the top end Android business, which we’ve seen since Q2 last year.

Apple meanwhile officially stayed static, mainly by “stuffing the channel” – getting carriers and others to buy phones which hadn’t reached customers by the end of the quarter, but counted as “shipped”; about 3m were pushed that way. This means Apple’s numbers of shipments to customers probably rose only minimally to 75m. Gartner’s figures say that Apple’s sales to end customers actually fell.

But there’s a bigger dynamic going on. Philip Elmer-DeWitt posted a fun interactive graphic showing how Android ASPs have moved compared to those for the iPhone. Here, statically, is the data – which comes from IDC and covers all Android handsets, of course, not just those at the top end from the companies which publish public figures:

The gap between iPhone and Android average prices is widening

In US$, iPhone average prices are remaining high; Android prices are falling as its base grows

The growing gap (or “delta”) between those two is dramatic. Of course part of that is what’s happening as Android reaches more and more people in the world: the poor in Kenya can’t afford an iPhone, but they can probably afford a $50 (Android) smartphone if it will help them do their jobs better. So is this just about Apple hanging on to profits as is often suggested? Not at all, responded Horace Dediu:

“Within the price is perception.” It’s quite the observation. As Dediu also pointed out, Apple hasn’t changed the selling price of its Mac line of computers for around 20 years. For all that Apple’s prices seem out of reach, that is precisely its attraction to some people – perversely, in the view of those who see smartphones (and PCs) as utterly functional and interchangeable. To some, they really aren’t.

And to continue having that perception, Apple also has to stand apart with its operating system and services. It could never license iOS; and I don’t see how it could make iMessage cross-platform without diluting its brand value. (That doesn’t mean it couldn’t grow iMessage into a messaging platform in its own right, able to do payments and so on.)

The pricing gap

With Android phones getting cheaper all the time, there’s not a lot of hope for the former premium makers. Kantar ComTech posted a neat graphic showing how the torch is passing among Android users in the EU’s five largest countries (Germany, UK, France, Spain, Italy) which shows this starkly:

Outflow from HTC, Sony, LG, Samsung to Huawei, BQ, Motorola, Wiko and Alcatel

Owners are abandoning established Android OEMs (purple) for rivals (green). Source: Kantar.

You’ve probably heard of Huawei, but would you have picked Alcatel or those others as rivals to Samsung or HTC? Probably not, even a few quarters ago.

LG is trying to escape this by effectively making this year’s G5 flagship modular, with add-ons such as cameras, high-end audio DAC and VR systems that you can plug in. The idea is to make the G5 more attractive because it has these extras. However given the numbers of G5s it’s likely to sell (a few million?) those add-ons (called “Friends”) are likely to be stranded. (I remember the same with Handspring’s add-ons. Great idea, but commercially doomed.) It’s extra revenue, and possibly each Friend sold will generate as much profit as a phone – accessories can do that – but won’t push up the ASPs of the actual phone. And if Friends are made available for cheaper LG phones, why would you buy the flagship when you can get the extra functionality of a Friend for cheaper?

Samsung has in effect already cut the price of the S7 by offering a free VR system to anyone who pre-orders. And Sony has Osborned its existing products with its announcements at Mobile World Congress, which its high-end customers will have noticed.

None of this helps with the finances, or fights off the rise of cheaper, just-as-good devices running the same software.

The Android handset market is broadening, and deepening, like a pothole opening up beneath the previoiusly established companies. Xiaomi (VC-funded), Huawei (big network business throwing off cash), scores of tiny Chinese OEMs, niche makers… they’re all eating away at the edge of what seemed like a certain market.

And add to that the slowdown in the smartphone market, and you have a recipe for a repeat of that rat pit we saw referred to way back at the top. It’s going to be last man, or OEM, or if you prefer rat, standing.

Looking down from the precipice into the rat trap

But what does Apple do in all this? The gap between its average price and that of the “average” Android phone is widening all the time. Isn’t that a problem? A big one?

Yet Apple’s brand, and that position, isn’t built on hardware alone. You don’t hear about people using an iPhone in spite of iOS, the way you do about Samsung and its TouchWiz skin, for instance. iOS’s software reputation remains pretty solid: it hasn’t, despite many predictions, lost its lead in getting apps before Android in the west. (As a reminder, Eric Schmidt’s “in six months developers will be writing for Android first” promise was in December 2011; didn’t work out, at least in the west. Asia was and remains Android-first for most things.) iOS 9’s adoption was faster than iOS 8, despite the ecosystem being bigger. Apple Music seems to be winning users, though it’s a long, long way behind Spotify, especially on Android.

The question of how Apple can maintain its pricing in the face of the rampant deflation in the Android handset market remains the most interesting one around. Yet it has managed that in the PC market: its ASP there is $1200, while that for the “big” PC makers ranges from $300 (Acer) to $500 (Lenovo). And it has managed that for more than a decade. But it’s done that as a niche product which has only recently become more mainstream. In the phone market, its share of all handsets in Q4 was over 10%, and 19% of smartphones. Can you maintain premium pricing and be mainstream?

For the Android OEMs, though, the story remains the same: you’re down there in the rat trap, and that curious face above you gazing down is Javier Bardem, waiting to see who’ll be left at the end. And I’m just behind, looking over his shoulder, just as fascinated.

Explaining the iPhone’s #error53, and why it puts Apple between conspiracy and rock-hard security (updated)


The TouchID system on the iPhone 6 is difficult to fix because it’s linked to Apple Pay. Photo by Janitors on Flickr.

There’s been a huge amount of coverage on the topic of “error 53”, which is a message thrown up by iTunes when it detects a particular fault on newer iPhones. But of course the rewriting hasn’t actually tried to add any value or understanding, for the most part. (Oh, internet journalism, if you only knew how crap you are.)

Techmeme coverage of "error 53"

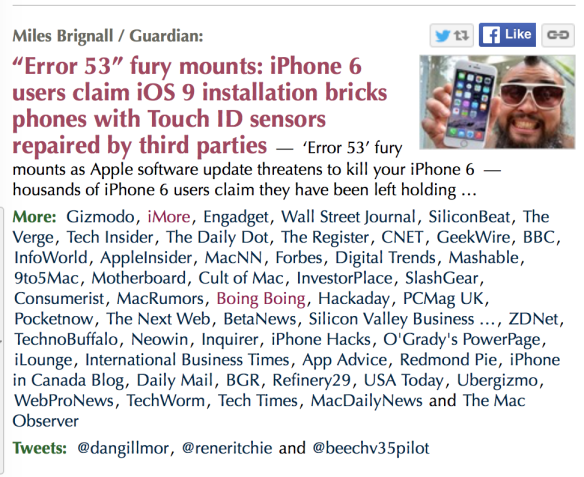
Techmeme coverage of “error 53”: did any of it add any detail?


So here’s my attempt to explain it, starting from what we know, and what we can find out, and what we can deduce. On with the show!

What is #error53?

It’s the error shown in iTunes for an iPhone 6, 6 Plus, 6S or 6S Plus after an operating software upgrade (eg upgrading from iOS 8.1 to iOS 8.2, or 8.1 to 9.0, or 9.2 to 9.2.1) if the phone has had its TouchID sensor replaced or its cable interfered with since the last software upgrade.

Error 53 (almost) bricks the device: it tells you to plug it in to iTunes and recover it, but in the instance above it won’t work. There is a way to bring the phone back to life if you’ve had Error 53, which we’ll come to presently.

Update: Apple has now (February 18, ten days later) released an iOS update for those using 9.2.1 and updating via iTunes which fixes this. Read the support document.

This is just Apple trying to stop third-party repairs, isn’t it?

That’s the conspiracy version of the explanation, but it isn’t self-consistent. Third-party repairers say they can still replace batteries, screens, and various other bits. What they’ve learnt though is that doing anything with TouchID on the iPhone 6/etc can kill the phone. So they avoid doing those repairs, and tell people to take affected phones to Apple repair shops.

Note that third-party repair shops have known about the home button problem for a long time. However, it’s only just come to media attention.

Why doesn’t it happen to the iPhone 5S?

The fact that this only began happening with the iPhone 6/Plus sharpened the conspiracy that this is Apple trying to shut down third-party repairs. (But it also weakens the conspiracy theory, because wouldn’t Apple seek to block it on all devices?) The reason is down to the key difference between the 5S and the 6/Plus: the 5S doesn’t have NFC, and so can’t do Apple Pay.

Why does Apple Pay matter in this?

Apple Pay means the phone contains Secure Elements, which are cryptographic stores with credit card and payment data – including (I surmise) how to turn a credit card number into an NFC payment mechanism, which is not the sort of information that banks want to be leaked everywhere.

Why does it only happen after an OS upgrade, rather than right after a replacement?

To understand this, we have to go to Apple’s security documents about iOS 9, and how security works with TouchID (the fingerprint reader), the Secure Enclave (which stores a hashed version of your fingerprint) and the Secure Elements, which store key financial data in an encrypted form.

Here’s a diagram from Apple’s security document, showing the direction of trust as the device boots up: it travels from the bottom to the top. We’re only interested in the stuff at the bottom of this stack at present (from “Apple root certificate” upward to the top of the “hardware/firmware” part).

iPhone security system begins with the hardware

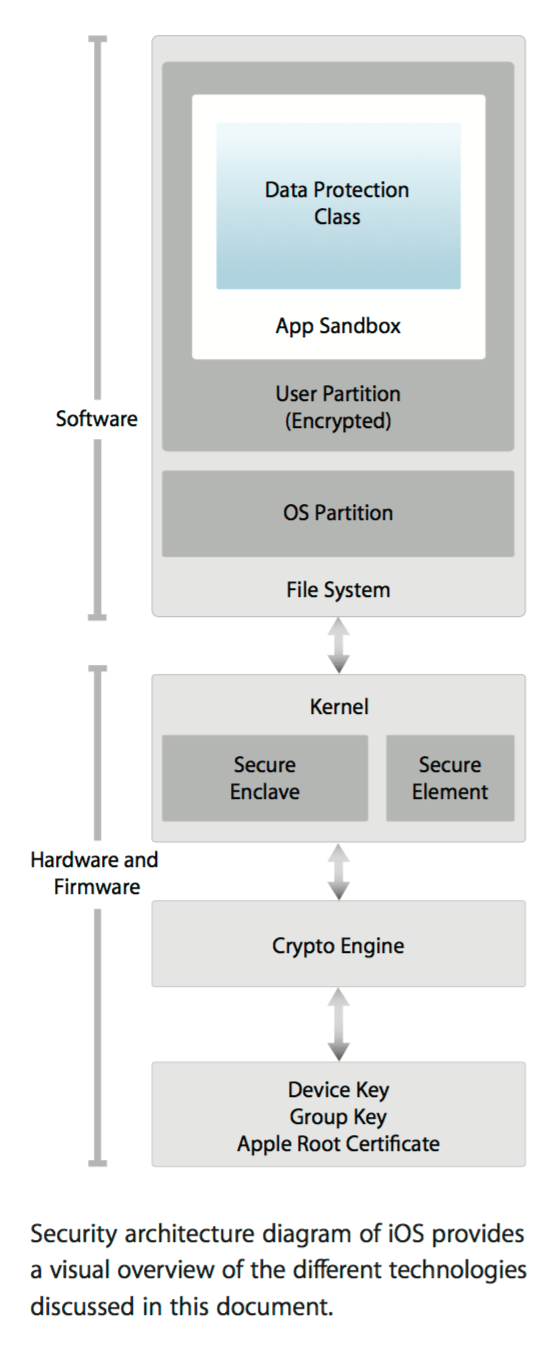
Apple’s explanation of how the security system works in the iPhone: booting starts from the bottom and progresses upwards.

On bootup, the system goes through various hardware checks to ensure that everything is tickety-boo, cryptographically speaking. If it finds something wrong, then it gives you the “Connect to iTunes” screen, and if you’re lucky, throws up an error message. Note that if something is wrong at this bootup stage, you don’t reach the higher level of the file system and OS partition; you’re stuck at the hardware/firmware level.

If you replace the TouchID system on a device, the system doesn’t throw an error at this point. Why not? I’m not completely sure, but I think that the TouchID subsystem doesn’t have an entry in the device’s own hardware/firmware listing, so the device can’t tell whether the TouchID system that’s installed is the same one it originally had at manufacture.

Update: on thinking some more about it, I think this is why. The security model is one which doesn’t trust values that are stored on-device but not burnt into hardware. So any value in a firmware register could have been changed. Now, if the TouchID serial were stored on hardware, it could be checked on boot to see if it’s trusted – but you’d never be able to replace the TouchID sensor, because the old serial is burnt into the chip. A firmware value on startup can’t be trusted because it might have been changed.

Therefore the device doesn’t brick when it’s first turned on after repair. It has to rely on something external which has stored the TouchID serial – that is, Apple’s installation authorisation server./Update

What happens on a software upgrade is subtly different from simply booting. From Apple’s document, on p6:

During an iOS upgrade, iTunes (or the device itself, in the case of OTA [over-the-air] software updates) connects to the Apple installation authorization server and sends it a list of cryptographic measurements for each part of the installation bundle to be installed [emphasis added] (for example, LLB, iBoot, the kernel, and OS image), a random anti-replay value (nonce), and the device’s unique ID (ECID).

The authorization server checks the presented list of measurements against versions for which installation is permitted and, if it finds a match, adds the ECID to the measurement and signs the result. The server passes a complete set of signed data to the device as part of the upgrade process.

Adding the ECID “personalizes” the authorization for the requesting device. By authorizing and signing only for known measurements, the server ensures that the update takes place exactly as provided by Apple. The boot-time chain-of-trust evaluation verifies that the signature comes from Apple and that the measurement of the item loaded from disk, combined with the device’s ECID, matches what was covered by the signature.

These steps ensure that the authorization is for a specific device and that an old iOS version from one device can’t be copied to another. The nonce prevents an attacker from saving the server’s response and using it to tamper with a device or otherwise alter the system software.

What I think is happening is that the new TouchID system’s serial number is in included in the cryptographic data sent to the authorisation server, and when that is compared against what it should be for the given ECID, the numbers don’t match.

At that point, the authorisation server decides that Something Bad is going on, and blocks the update. The device now fails the low-level boot – it can’t get past the kernel level to the OS boot – and so the device is bricked.

And that is why it bricks on a software update.

Why doesn’t it check with the authorisation server after the repair?

The phone doesn’t have any way of “knowing” whether it’s restarting after a repair, or after it ran out of battery, or you just turned it off for the night. If every phone were to check in with the authorisation server on being powered on, three things would happen: (1) the authorisation server would die (2) people would be furious because their phone wouldn’t boot because it would need connectivity to check the details for its ECID, and you don’t always have connectivity when you turn your phone on (3) Apple would get majorly dinged for “snooping on when people turn their phone on.”

That doesn’t explain why it doesn’t happen on the 5S, though.

Damn right. At which point we have to consider that the “cryptographic measurements” sent back for an iPhone 6/etc differ from those of an iPhone 5S, specifically because of the Apple Pay-related Secure Elements.

Why does the device still work after the third-party replacement?

Let’s qualify this: it does work, but TouchID (and so Apple Pay and others) don’t work after a third-party fix that affects TouchID. The pairing there between the Secure Element/Secure Enclave/TouchID, which was set up when the device was manufactured, is lost. It carries on not working; then at some point, you get a software upgrade notification. And then – disaster.

Considering this, I think what is stored for communication with the server is the TouchID pairing status. If it’s unpaired, the update can’t go ahead.

Update: the fix issued by Apple must tell it to go ahead if the TouchID pairing status is changed, but leaving TouchID disabled.

What if you’ve never set up Apple Pay?

Doesn’t matter. The issue is not the data you’ve stored in the device, but the data that’s built into the device – cryptographic keys used for creating payment authorisation for credit cards. Those are in the Secure Elements.

What are the Secure Elements, and what do they contain?

Here’s a definition:

An SE is a tamper resistant hardware platform, capable of securely hosting applications and storing confidential and cryptographic data. For example, in the finance industry SEs are used to host personalized card applications and cryptographic keys required to perform financial (EMV) transactions at a point-of-sale terminal. SEs used in the identity market may hold biometric data or certificates which can be used for signing documents. Whichever purpose, the secure environment provided by the SE protects the user’s credentials ensuring the safety of the user’s data.

The reason why Error 53 happens when you change or interfere with the TouchID sensor on a more-recent-than-5S phone is that the system detects – during the software upgrade – that something has changed, and that the embedded trust system has been broken. And so the device doesn’t get authorisation to update.

Why does the Secure Elements stuff matter, though?

The banks/financial institutions specify that the operating system must not be able to directly access the data in the “trusted zone” (the Secure Elements).

How can you recover from Error 53?

Quite simple: replace the new TouchID processor with the old one. (People say they have successfully done this.) However, saying it is a lot easier than doing it. Some people don’t have the old one. Or the old one might just be broken.

How does Apple replace TouchID systems?

We don’t know, but we know it can, because it does. There must be a method for updating the cryptographic measurement list held by the authorisation server for a particular ECID. I’d imagine that involves logging into a server, entering an ECID (or connecting the phone) and letting the two talk to each other.

Note that when you have your screen repaired by Apple, it will tell you to disable TouchID first. And afterwards, you’ll have to recalibrate it. So there might be something there.

Why can’t Apple do that to devices which have failed on Error 53?

We don’t know. (Possibly it can.)

Could Apple change things so that in future it just disables TouchID and software updates still work?

Perhaps. I suspect it would need some sort of adjustment to what gets sent to the authorisation server, or what the server considers OK to approve. But if Apple is tied here by what the financial institutions demand around the Secure Elements, it might not have the choice.

Why hasn’t Apple explained that this is a risk of third-party replacement?

Ah, now we come to the challenge of Being Apple. Its mystique (for that’s what a lot of it is) lies in saying very little about how it does things, and asking people to take this stuff on trust, or for granted.

Thus when it comes to repairs, Apple’s implied assumption is that everyone will bring their device to an Authorised Apple Dealer, or Apple, to get it fixed. This ignores the fact that it now sells phones in countries where you’d have to travel for hours and hours to reach either of those – if you were lucky.

Naturally, people go to third-party repair shops to get these things done. And then problems start, because you’re talking about a pocket supercomputer with embedded cryptographic systems that are sensitive to being fiddled with.

But Apple has done a bad job here in communicating the risks of getting anything around the TouchID system replaced. It really needed to get the message out there.

Why didn’t Apple get the message out there?

Probably it’s been difficult to separate the signal from the noise on this. If someone comes in to an Apple Store with an Error 53 phone, it’s hard to know at first why it has done it. The device gets replaced, and the old one sent back to Apple, but that’s barely half of the feedback loop: it has to reach Apple, someone has to figure out why it doesn’t work, and then inform stores, and also inform the marketing people that this can be a problem which needs to be communicated.

Very likely there are people in Apple Engineering, Apple Retail and Apple Marketing who are right now looking at an email trail and smacking their foreheads as they realise what the problem they missed was. Those phones sent back from the stores marked as “will not boot”… ohhh.

That’s the problem with big organisations, though: that sort of feedback loop is really, really hard to organise well. Alternatively, perhaps it has been noticed, but it hasn’t affected a large number of people, and so isn’t as high a priority as.. something else. (We don’t know what.) Of course, to the affected people, it’s a bloody high priority.

Shouldn’t Apple allow third-party TouchID repairs, though? After all, the phone is your property.

The “property” argument isn’t a great one, to be honest. Apple sells you a device, but it doesn’t give you untrammelled rights to it; you aren’t legally allowed to (try to) decompile the software, or the firmware, or to dig into things like the Secure Elements. You don’t own the entire thing.

That’s how things are these days; the open-software absolutists run into a problem with mobile phones, because even if you can download and compile the operating system (a la Andy Rubin) you won’t be able to do that on the baseband software which actually provides the mobile functions. So it’s never completely “your” phone. That’s the case with PCs too these days – there’s stuff on the motherboard you don’t get to mess with.

None of this proves it isn’t Apple just shutting out third-party repairs, though.

Ah, proof. It’s so hard to prove the imaginary, or to refute it. However the scenario where some Apple executives gather round a table and say “You know what? We’re losing valuable revenues and profits from people using third-party repairs! We need to brick those phones!” fails both Occam’s Razor and Hanlon’s Razor, the two logical tests that help you filter through a lot of modern crap.

Occam’s, you’ll recall, is “don’t let entities multiply unnecessarily – aka “the simplest explanation is probably the right one.” Hanlon’s, meanwhile, is “never ascribe to conspiracy what can more easily be ascribed to cockup.”

Why does “shutting out third party repairs” fail Occam’s? Because it requires a lot of people putting in varying amounts of effort to make it happen.

For the malicious version: Apple has to have decided (1) it doesn’t like third-party repairs; (2) it wants people to have a bad experience when they try to upgrade their software (is it certain people will connect the third-party repair with the bricking, given that the events might be weeks or months apart? They might even have had an Apple fix of some sort in the meantime) (3) to set in motion an internal program whereby third-party replacements using correctly-sourced parts will fail, but its own repairs using the same parts won’t (quite risky) (4) to keep all this secret while also instructing its repair shops how to do this.

For the accidental explanation: the new TouchID system on the iPhone 6/etc now pairs with the Secure Elements and its cryptographic signature is sent to the update server on device activation. If the signature doesn’t match on subsequent update requests, the device isn’t authorised.

See how much simpler the latter one is? It doesn’t require any executives, or nefarious planning; just some work by the engineers updating the TouchID/Secure Elements systems. That satisfies Occam.

But equally, the second also satisfies Hanlon’s Razor. Nobody has been malicious; if anything, they’ve been trying to safeguard customers by making sure that sensitive (to financial groups) information can’t get hacked off your phone. However, in doing that, they’ve created a situation where customers get a bad experience and Apple gets bad publicity over something it would have hoped would give it kudos.

The shibboleth

In all the coverage of this topic, it is quite amazing how ready people are to assume the worst. Apple is uniquely capable of polarising people, who find it exceptionally hard to be indifferent about what it does. Either it’s a sort of wellspring of ideas and direction in all sorts of markets, from PCs to mobile phones to smart watches; or it’s a malicious money-grabbing marketing machine seeking ever more ways to rip people and governments off, while foisting commodity products on people at sky-high prices.

For instance, where do you think Cory Doctorow stands on it?

Punish. There’s a verb.

Or Dan Gillmor?

(Both links in those tweets are to the same Guardian article that kicked this all off on Saturday.)

Yet if you look on Hacker News, you’ll find the tenor of the discussion is much more like “oh, that makes sense from a security point of view”. And security experts on Twitter such as Steve Bellovin and Matthew Green could discuss the matter without invoking conspiracy theories.

I find it odd that people who write publicly for money seem more willing to go for the conspiracy theory than those who don’t. Doesn’t exposure to enough organisations teach you that the bigger they get, the more easily screwups happen, and the less communication there is between their many arms?

And Apple really is big these days, stretching across an incredibly broad area of the computing market – from Macs to mobile phones to tablets to smart watches to iPods, from desktop operating systems to mobile operating systems (tweaked differently for the tablet and the phone), to smartwatch and TV set-top box operating systems, to desktop and mobile applications, to cross-platform music programs (iTunes is on Mac OSX and Windows; Apple Music is on iOS, Windows, Mac OSX and Android), to web services (CloudKit) and even chip design.

I’m pretty confident in saying that no other company is doing as many things across as many hardware and software platforms. Google is huge, but doesn’t make hardware in anything like that volume; Microsoft is huge too, but doesn’t make hardware in any appreciable volume. Apple does the whole thing, including chip design. The combination of hardware and software challenge in adding just one new feature to any individual device line is mind-boggling, because you have to consider how it’s going to affect everything else.

In that context, an engineering team working away on an improved TouchID system which authenticates against tampering probably thought they were doing just the right thing. Instead, they were throwing their retail and PR people into a media storm. The size of the teacup is yet to be determined.

Quite how Apple is going to get its explanation across will be educative to watch. (I haven’t spoken to Apple in writing this.) The more interesting question though is: what will happen once lots of Android devices start using Android Pay (which has pretty much the same trust requirements) and those start breaking? Will third-party repairers be able to fix them, or will they have to be sent back to the manufacturer? And if it’s the latter (or if people try the former) how much hell is there going to be to pay?

Though you suspect you know the answer already. It won’t arise, because not that many OEMs will implement Android Pay, and the people who get inconvenienced won’t make as much noise about it. Who cares if someone with an HTC phone has to swap it and loses their data? You’d struggle to get most newsdesks to know what an HTC phone was. Say “iPhone”, though…

Yes, Google’s UK back-tax payment is derisory. Here are the numbers that show it.


Google UK: it’s either gigantically expensive to run, or there are tax shenanigans going on. Photo by osde8info on Flickr.

The UK is the only region besides the US for which Google breaks out revenue in its quarterly earnings, because – for whatever reason – the UK represents 10% or more of Google’s total revenue. (Public companies are generally obliged to cite countries or regions which generate more than 10% of revenue in their results.)

Google doesn’t, however, break out profits for any region; it just gives a single figure for operating and net profit.

Update: note that this post doesn’t take into account any of the amazing workarounds that companies use to shift “activity” from one place to another; for example, Google doesn’t even accept that it has a “place of activity” in the UK. For instance, look at Jolyon Maugham’s analysis, and especially the comments that follow it.

But what if we were to try to estimate (in a fag-packet way) how much profit Google has made in the UK, and then compare that to the tax it has paid, and the tax that it recently paid in a settlement with the UK’s tax authorities, HM Revenue & Customs?

Tax, of course, is payable on profit, not revenue. And it’s helpful too to compare Google with other UK media companies which sell advertising and have other activities.

So take a look at the tax paid by another UK-based media company of comparable size – ITV.

ITV’s interim results (for the six months to end June 2015) show six-month revenues of £1.53bn, with profit before tax of £391m, compared to profits for the same period in 2014 of £312m. And here’s the profit before tax figures (for six months).

Screenshot 2016-01-24 17.29.39
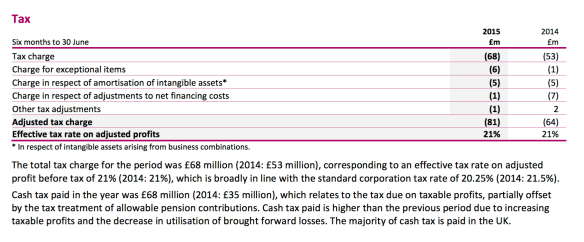
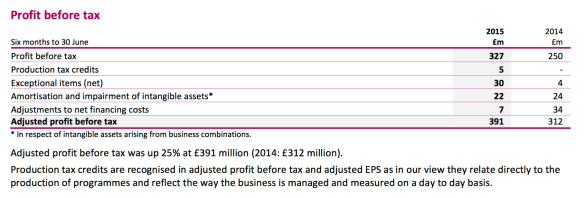
On which it paid tax of £81m (first six months of 2015) and £64m (first six months of 2014) – an effective tax rate, as it points out, of 21%.

Screenshot 2016-01-24 17.29.27.png

Now let’s move on to Google. Its UK revenues are as follows – all given in US$:

Screenshot 2016-01-24 17.35.09

Note that these are a LOT more than ITV’s. But how do we get from this to its profits? The simple way is just to adopt the overall profitability of Google, the corporation. As a rough-and-ready way of approaching Google’s UK profits, it will have to suffice. The UK doesn’t have the expense of the “moonshot” operations such as self-driving cars; most of the activity is around advertising, though there is also an Android development team (whose work is allegedly actually “happening” in California for tax purposes) and various building works which will all affect immediate profitability because they’re expensive.

But let’s try anyway. Let’s use Google’s overall operating profit margin for each quarter, and use that to calculate the UK profits. It’s not perfect, but it’s a start.

I’ve done that in the table below, using the data from Google’s accounts, and its operating profit/revenue (hence operating profitability margin) to calculate a notional profit; then I’ve multiplied by the prevailing exchange rate (which has varied a lot over the years); and then I’ve multiplied the notional profit by 21% to get the “tax payable”.

Screenshot 2016-01-24 18.19.02

Screenshot 2016-01-24 18.31.14

The numbers are staggering. Google’s UK division has probably made profits of more than 7 billion pounds since the fourth quarter of 2005 (which I used simply because I couldn’t get exchange rates going further back) on revenues (stated) of $39bn – generating an assumed profit of $11.56bn, or £7.11bn.

And the tax payable on that amount? Assuming that same 21% rate as ITV, the total tax payable would be just short of £1.5bn.

And.. how much tax has Google paid in the UK?

The latest stories to emerge of the deal with HMRC suggest that Google is paying back tax to cover just that period to 2005.

“We have agreed with HMRC a new approach for our UK taxes and will pay £130m, covering taxes since 2005,” a Google spokesman said. “We will now pay tax based on revenue from UK-based advertisers, which reflects the size and scope of our UK business.”

How much tax has Google paid in the UK? A total of £200m if you include this latest £130m amount, apparently. Which works out to a tax payment rate of 2.8%. Sure, there may have been lots and lots of costs involved in setting up Google, which are offset against tax. But I doubt they’re bigger than ITV, for instance, has to pay.

Google’s deal with HMRC has been called “derisory”. The figures here suggest that that description is absolutely correct. If Google is generating this much revenue in the UK – a fact which it states in its earnings reports, for which its executives are legally liable – then it would be terrific if it could explain quite how it is so dramatically expensive to run such a business that it generates such pitiful profits. Update: the explanation given by tax experts is that the revenues are *generated* in the UK, but *booked* in Ireland, so that the “profit” arises in Ireland, which doesn’t tax it. This “generated in UK but booked in Ireland” point is the one which led to an almighty furore in 2013 when Matt Brittin of Google

stood by evidence he gave last year that all the company’s European sales were routed through its operation in Ireland and so were not liable to UK taxes.

To which the committee chairman, Margaret Hodge, responded:

“You are a company that says you do no evil and I think that you do do evil in that you use smoke and mirrors to avoid paying tax.”

Among the criticisms of the deal with HMRC are that it must have been done with some sort of principle in the minds of those who agreed the deal for HMRC – in which case it would be useful for other companies to know what principles exactly are in play. It’s time for transparency on this.

How close was my forecast for HTC’s 4Q? Only 3.4% out

Back on 5 November I gave a forecast for HTC’s fourth-quarter (October-December) revenues, based on its October revenues. HTC hadn’t deigned to give on, but using historical figures I had a stab.

My forecast, then: NT$26.64bn, with a 10% error either way, giving a range of NT$23.9bn-29bn.

And how did I do? HTC published its monthly revenue figure for December, which was pretty dramatically down on the previous year, by 57%. In fact the December revenues were its lowest since at least 2005 – my data doesn’t go back further than 2006.

Here’s the graph of my forecast and the reality:

HTC's monthly revenues - actual v forecast

HTC’s 2015: pretty terrible, actually

The total revenue for the fourth quarter: NT$25.75bn, which comes in at 3.4% less than my midrange forecast. Thus making the point that if you collect enough data about the past, you might have a chance of getting close to a prediction about the future.

At the end of the third quarter its “cash and equivalents” were US$1.3bn; that’s getting eaten away by its losses. (In aggregate, it hasn’t made a penny in net profit since the third quarter of 2012 – all its profits in nine quarters of that time have been eaten by four quarters in which it made losses.) Its inventories, meanwhile, were 97% of revenue in the third quarter. That’s an excessive amount; you’d normally want those to be as low as possible, since money sunk into inventory is an opportunity cost: you could be spending it on something else, like marketing.

Gross profit at 18% will be NT$4.63bn, so the operating loss will probably be the same as I forecast, at around NT$4bn (US$125m). Full results later this month. Update: HTC announced (PDF) fourth-quarter operating losses of NT$4.1bn; gross margin was 13.9%.

In other words, HTC will never make a profit again in smartphones. Notice too how everyone has forgotten about the HTC Re camera.

Chief executive Cher Wang, interviewed by the Telegraph, doesn’t quite deny that the company might fold the smartphone tent:

“Yes, smartphones are important, but to create a natural extension to other connected devices like wearables and virtual reality is more important… We have a vision of smartphones with different types of form factors, it won’t always look like this,” she says.

So now its attentions turn to virtual reality, with the Vive, which seems likely to be priced around $1,500, with preorders starting on 29 February. (That should give the first-quarter numbers a boost, anyway.)

I’ll go out on a not very long limb here. The Vive’s specifications are high-end: you need to buy not only the headset, but also to have a really high-spec PC to do anything useful, and applications are thin on the ground. It’s going to have a tiny audience at first. Even there it’s competing with bigger and better-funded rivals, including Oculus (owned by Facebook – has a bit of cash) and Samsung (has a bit of cash) and Sony (has cash and installed base of gamers). Ignore specs, because actually buyers mostly will: what’s the reason to buy VR kit? For the experiences. If Valve doesn’t really come through on this, HTC is really going to have a serious problem.

Update 25 January: given the power of this attempt, I’ll have a stab at forecasting HTC’s January 2016 revenues, based on December 2015. The average of the nine years since 2006 suggests that January generates revenues 83.96% as large as December, with a standard deviation of 15.3%.

HTC’s December revenues were NT$6.52bn. Using those, the data suggests HTC’s January 2016 revenues will be NT$5,472m, with a potential range (on one standard deviation) of NT$4.47bn to NT$6.46bn (which is about 18% either way, so quite a large range; the key point is that the forecast suggests January’s revenues will be less than December’s). The first figure is less than US$200m at present exchange rates. We’ll find out the correct number in a week or two.

Post-update: HTC’s January 2016 revenues were NT$6.477bn – just over the top end of my forecast, but still less than December’s (just) and down 47% year-on-year. It’s less than US$200m per month.

Apple has a *lot* more people using its Music app since June


Beats1: listen for free. Photo by Janitors on Flickr.

Here’s a thing: substantially more people in the US are using Apple’s Music app since the launch of Apple Music at the end of June.

I’d already noticed this last week, but coincidentally on Sunday Apple let it be known that Apple Music now has passed 10 million (paying) subscribers. That’s up from 6.5m in October.

(As an effort to provide a counterpoint, Tech Insider said that Apple had claimed 11m trial subscribers back in August, so nyaaah. Except on reflection, that’s not surprising: many more will have signed up and dropped out.)

Spotify, not impressed, responded that it had had its “fastest subscriber growth ever” in the second half of 2015. Tech Insider ran the numbers, which would mean 5m new paying subscribers, and perhaps put it at 25m-30m paying subscribers.

But anyway, let me put in my chunk of insight. Which of course goes against the general punditry that Apple Music is rubbish, worse than Spotify, etc. This is the trouble with punditry: it tends to be myopic and ignore what lots of people actually do. (Sure, Apple Music’s interface and general paradigm can be confusing: what’s “my” music and what’s “Apple’s” music? Why are they different? That’s a result of the challenge of migrating people used to “download and own” to “stream and never own”.)

Wo-o-oah, listen to the Music

The data comes out clearly from the latest ComScore data surveying phone use, which takes us up to November 2015. ComScore monitors which apps people use on their phones during each month; the top ones, as you might expect, are Facebook, YouTube and Facebook Messenger. ComScore lists the top 15 (for iOS and Android – neither of the other two platforms has large enough user bases to be relevant) and you can work out the absolute numbers using a service, as well as the percentage, quite easily.

I’ve been collating the ComScore data for a long time, and the jump in Apple Music users since the service’s launch on 30 June is very noticeable. To make sure it’s not some weird artefact of its collection, I’ve compared it with another iPhone-only service, Apple Maps.

Here’s the percentage figure:

Screenshot 2016-01-08 14.28.18

And the absolute numbers:

Apple's Music app got a lot of new users

Apple’s Music app total users in the US (green line) v Maps (blue line). There’s a big jump.

There’s a general trend upwards in both services, but that’s also the same for Google Maps – in the same period from July 2013 to November 2015 its user numbers have gone from 61m to 91.1m, though with seasonal dips.

The absolute numbers for Apple Music are pretty impressive: they rose immediately from 46.8m users in June 2015 to 57.5m in July. In November, which is past the three-month trial period (if you’re trying the paid-for streaming service) it was 59.7m.

On that basis, it looks like Apple Music has got around 10m extra people using the Music app more regularly. That doesn’t mean that they’re necessarily paying for it; you can listen to Beats1 Radio for free, for example.

And there may be lots of people who are rolling into and out of the three-month unpaid trial. (I’m definitely not suggesting they’re all paying subscribers – that doesn’t make any sense.)

But the ComScore data looks like substantially more than a statistical blip. (I can’t tell whether iTunes Radio, launched in the US in September 2013 and later in Australia, made any difference; ComScore didn’t collect the Music app data back then.)

Apple’s going to keep adding subscribers, too; it has passed 1m downloads on Google Play, and some of those are sure to stick.

What about the others?

What about other music services? Pandora is the most used service on ComScore’s data, with between 77m and 80m users across both iOS and Android in the same period; it doesn’t vary much.

Spotify doesn’t figure in the top 15 apps via ComScore, and never has; that means it must have fewer paying (and so mobile) users in the US than Snapchat, which has made a couple of appearances in the top 15 with about 22m monthly active users. But since we’ve already seen that Spotify’s worldwide paying user base (who are the only ones who can get it on mobile) has only just hit that figure, that’s not surprising.

This isn’t a fair comparison for Spotify, though: both Pandora and Apple’s Music app have free elements (you can just be using the Music app to listen to your own music, while Pandora offers free streaming in the US). It’s quite possible that it has a few million users in the US; its repeated appearance in the top-grossing charts for the US suggests it is getting some useful subscription moolah.

At the same time, that jump in Apple Music users does point to something else which the numbers above already point to: the streaming business can be additive – it’s not limited to the small numbers who are using it now. Apple has added 10m paying subscribers to the pool in six months, and Spotify has added perhaps another 5m. For music, that has to be good.

The YouTube problem

If the labels could be persuaded to lower their prices, it might expand the paying audience for streaming services even further. Though the enemy to that is always YouTube, the giant elephant in the streaming room, used by millions to get their music fix for free. (Read Mark Mulligan on this; it’s truly quite scary for those used to the old world of the music labels.)

Until the music business figures out what it wants to do about YouTube, persuading people to pay for streaming in substantial numbers will continue to be a struggle. But it can be done.

Dark matter full of piranhas: Android, Apple and the 3Q 15 smartphone scorecard


Remind you of the smartphone market? Red piranhas photo by Stig Nygaard on Flickr.

A friend of mine recently showed me his new handset. “It’s a Huawei,” he said. “Never heard of them, but it was a good price, and it does all I need.” He’d bought it to replace his ageing Nexus 4, and he seemed happy.

And so goes another example of Android dark matter: a company that is selling lots of handsets, but where we have no idea whether it’s making any money from them.

Yet we might guess that the answer is a qualified “no” when we look around at its rivals. Another quarter, and the profit story remains much the same: Apple and Samsung are making it all. The others whose financials we can actually see – LG, Sony, HTC, Lenovo, Microsoft, BlackBerry – all lost money as though it was what you’re meant to do. The big mystery: Huawei, which was the third biggest smartphone maker in this period, but doesn’t release financials. Is it making money? If so, it’s the only Android OEM besides Samsung which is to any notable extent.

But the third quarter, from June to the end of September (already receding into the distance) is notable because we’re now seeing the effect we’d expect from the rapid expansion of the Android OEM business: price deflation. It’s becoming rampant, and it’s beginning to tear into Samsung, which is being eaten from below by piranhas.

The effect of this was that even though Samsung shipped more smartphones than it has ever done before – a titanic 84.5m – its mobile revenues were only its 9th largest, and its mobile profits only one-third the size of its biggest (which came in early 2013).

That equally raises a very important question for the future of the big noise in the smartphone business: Apple. If even the biggest Android OEM is having its prices yanked down by smaller but numerous rivals, how (or how long) can Apple maintain its gigantic difference in pricing compared to those rivals?

Note too that the smartphone market is still decelerating; from 11.9% growth (compared to the same period in 2014) in the second quarter, to 6.8% in the third, according to IDC’s numbers, which are the ones I use for consistency. (Gartner has a higher growth rate.)

World smartphone shipment growth by quarter

Data from IDC

Score that

I’ve added two columns to the scorecard this quarter: year-on-year shipment growth, and that growth normalised against the whole smartphone market. Apologies if this demands a lot of horizontal scrolling.

OEM S/phone revenue US$ (approx) Op profit US$m Op margin % S/phones shipped Implied ASP per s/phone Implied profit per s/phone Shipment growth y/y Shipment growth v s/phone mkt (6.8%)
HTC $0.674bn -$154m –23.1% 2.6m $259.27 –$59.85 –46.9% –53.7%
Sony $2.32bn -$171.7m –7.4% 6.7m $346.12 –$25.62 –32.3% –39.1%
LG $2.96bn –$88.6m –2.3% 14.9m $198.49 –$5.95 –11.3% –18.1%
Samsung $20.70bn* $2,440m 11.79% 84.5m $248.55 $28.86 +7.6% +0.9%
Lenovo
(inc Motorola)
$2.37bn* -$217m –9.2% 18.8m $126.22 –$11.54 –32.9% –39.6%
Total for ‘public’ Android $29.024bn $1,810m 6.2% 127.5m $227.64 $14.20 –7.7% –14.5%
Huawei ????? ????? ????? 26.5m ????? ????? +57.7% +50.9%
Xiaomi ????? ????? ????? 18.3m ????? ????? +1.1% –5.7%
ZTE ????? ????? ????? 16.2m ????? ????? +42.1% +35.3%
Total for “dark Android” ????? ????? ????? 61.0m ????? ????? +35.6% +28.8%
Apple $32.21bn $9,022m* (28% est) 48.05m $670.38 $187.76* +22.6% +15.8%
Microsoft Mobile $0.72bn* –$603m –83.8%% 5.8m $105.00 –$104.00 –38.6% –45.4%
BlackBerry $0.20bn –$180m* –89% 0.83m $242.16 –217.00 –61.9% –68.7%

* estimated smartphone revenues/profits/ASP only – excluding featurephones and tablets.

Working assumptions:
HTC: all revenues from smartphones – zero from the Nexus 9 tablet (pretty certainly true), zero from the HTC Re camera (probably true).
Sony: all revenues and profits from smartphones; zero from tablets – of which it shifted fewer than 1.6m, given IDC’s numbers; and zero profit from tablets. If tablets generated significant revenue and were profitable, then the smartphone ASP goes down, as does per-handset profit. (If tablets lost money, the per-handset loss is less.)
LG: $100 average selling price for the 1.6m tablets I’m estimating it shifted in the quarter. (That would put it equal with shipments in the previous quarter.) Tablets assumed to have zero profit, though they might have made some loss that made everything else look worse.
Samsung: featurephones (it shipped 20.5m) sold for $15, zero profit; tablets (8.0m) sold for $175 at zero profit. If the tablets or featurephones made any profit, then the profit from smartphones were lower.
Lenovo: assuming the 3.1m tablets it sold had an ASP of $100, and zero operating profit. If the tablet ASP was lower, Lenovo smartphone revenues were higher; if the tablets were profitable, per-smartphone loss was greater.
Apple: operating margin, as previously, of 28%. You could halve this, or even put it level with Samsung’s declared margin, and its operating profit would still be more than all the others’ profits (even ignoring losses) put together.
Microsoft Mobile: the figures here have to be backed out from the not-quite-stated phone revenue, including featurephones: “phone revenue decreased 58% by $1.5bn”, which takes us down to $1.1bn. There’s no gross margin given for phones, so I assumed –$104m, as in the previous quarter. Microsoft shipped 25.5m featurephones (up from 19.4m the quarter before, but down from 42.9m the year before) and 5.8m Lumia smartphones (stated; down from 8.4m the quarter before, and 9.4m the year before). Assuming featurephones had an ASP of $15 and made zero profit (same as with Samsung). The Lumia ASP has to be estimated, but seems reasonable.
BlackBerry: device revenue is given in financial statement; assuming software/services have gross margins of 84.5% (true historically), and that hardware R+D and sales costs are proportional to device revenues as % of overall revenues.

Troubles in common

Here’s the surprise: a number of Android OEMs managed to make their device ASPs rise from the previous quarter. First is Sony – up from $319.40 to $346.12. And who knows whether the $5m spent on product placement for Sony smartphones in the James Bond film Spectre won’t pay off some time. (They’ll have to have a hell of a return on investment, though.) HTC also managed it: up from $236.90 to $259.27. Lenovo also did it, up from $115.06 to $126.22.

And what else did those three companies, along with LG, all do? Lost money. The problem for premium Android goes on. We’re seeing the rise of “dark Android” – the companies which have huge reach (especially inside China) but whose finances are opaque. (All three of Huawei, ZTE and Xiaomi sell many, if not a majority, of their phones without Google’s services installed, because they sell them inside China.) Meanwhile Apple raises its ASP, and its profit rises in line, as far as we can tell.

The really interesting case is Samsung. A year ago, in the third quarter of 2014, Samsung had a terrible time: profits crashed and its semiconductor division became the most profitable part of the business – which is still the case. At that time, Samsung discovered that making a new “S” series phone wasn’t a guarantee of success; it was caught with lots of unsold Galaxy S5s sitting with wholesalers, and had to offer all sorts of discounts to get them moving, which hurt profits.

This time around, Samsung’s profits have risen year-on-year, but only because the same time last year it was so dire. The Wall Street Journal had some interesting data about how it managed to get so many phones sold: basically, it concentrated on the low-to-mid end. Screw the S6 and S6 Edge and its kin; this was about getting phones out the door.

…while 55% of its smartphones were priced at $301 per unit or more at this time last year, that high-end segment has fallen to just 40% of Samsung’s overall smartphone sales, Counterpoint said.

Phones priced $200 or below now account for 38% of total units shipped at Samsung, versus 30% this time last year.

You can work this out pretty easily:

Samsung phones sales, by price segment

Data from Counterpoint Research for 3Q 14 and 3Q 15

Here’s how that looks when you visualise it:

Samsung phone sales by segment, visualised

Data from Counterpoint Research. The mid-level segment is growing at the expense of the high-end one.

Look at how the blue and green edge up into the pricier yellow – which is now much smaller. And we’re comparing, remember, with last year, where the yellow (pricey) segment went pretty badly for Samsung as it was.

This is Samsung reacting to what’s going on in the market, and responding as it does best: by using its manufacturing and distribution might to try to squash competition. But in places like China and India, for example, local suppliers can compete pretty evenly:

“Samsung Electronics has decided to release the products priced at some 100,000 won for price competitiveness with Chinese and Indian smartphone makers. Local manufacturers, such as Xiaomi and Micromax, have already launched many models in the same price range. An official from the industry said, “Now, it is impossible to hold a dominant position in the competition just with a brand image of Samsung Electronics without releasing models in the same price range with local companies. When we have similar price competitiveness, we can defend our market share but profitability will get worse further.”

And LG? It’s getting walloped. Strategy Analytics says (in a super-pricey report I won’t buy) “LG’s global handset shipments dipped -21% YoY in Q3 2015. Competition from ZTE, Huawei and others ramped up across Asia and North America. A major challenge for LG is that it still has too many eggs in too few country baskets and it badly needs to diversify geographically for regrowth in 2016.”

I don’t see that happening. What I find remarkable is that top-end Android vendors are now howling into the hurricane. The LG G4 has a camera that seems remarkable in all the sample shots I’ve seen; yet it’s struggling to sell them. HTC might hope that the newly released iPhone-alike A9 will raise revenues briefly this quarter, but I’m pretty sure they won’t reverse its per-handset losses, which are looking awful:

HTC US$ operating profit per handset

Data calculated from HTC financials

Android’s dark matter

Consumers are clearly beginning to think that many other Android handsets are “good enough”. My friend with his cheap Huawei handset is just one example. ZTE and Xiaomi and OnePlus and, now, the UK’s WileyFox and Marshall (the amplifier makers, yes) and even Pepsi are all piling into the handset market, sure that they can make money.

In some cases, it’s quite possible they are: by restricting its supply and distribution, OnePlus has a model that can scale as long as it can keep a lid on demand. What the phone OEMs really want is to be able to move closer to a Dell-type model: where you order the device and it’s pretty much custom-made for you from modular parts. That means lower inventory, and certainty about pricing components and satisfying demand.

Meanwhile, Android OEMs such as LG, Sony and Samsung are faced with the harsh reality spelt out by Ben Bajarin in one of his columns:

as a market matures, the early innovators get disrupted by competitors who come into their space with lower priced products, similar specs (the specs that matter), and eat into the market share of the early innovator in the category. Once the market embraces “good enough” products, the innovator can no longer push premium innovations as their value is diminished once a “good enough” mentality sets in. Android devices in the $200-$400 range are “good enough” for the masses, leaving Samsung’s $600 devices and above stranded on an island.

As he points out:

the innovator’s dilemma, in this case, only applies to Android-land because all the hardware OEMs run the same operating system. As I’m fond of saying, when you ship the same operating system as your competition you are only as good as their lowest price.

This is what Samsung is reacting to, but Sony and LG and HTC can’t react to without cutting their own throats even more. They have high fixed costs in order to produce those super-high-resolution phones (QuadHD, anyone? Even if you can’t tell the difference?) but it doesn’t cut any ice with the public.

Meanwhile Huawei, ZTE and Xiaomi the dark matter of the smartphone business: we know they’re there because of the enormous influence they wield on everyone around them. They’re also the only part of the Android OEM business that’s growing. But it’s very hard to have any idea of their financial position. (You can get some idea: CoolPad says it can’t make sufficient profit to sell a tablet to compete with Xiaomi’s newest model at the same price.) The way that the low-price piranhas are piling into Android does remind me of the days when the iTunes Music Store was taking off, and every company in a vaguely associated area scrambled to have their own download store – HMV, Tesco, Wal-Mart, Virgin – without much consideration of how they’d turn it profitable; they just reckoned it was a good idea. (Most have now shuttered those stores.)

In the same way, offering an Android phone is beginning to look like a possible sideline for all sorts of companies, which speaks to the problem that the big Android players have: if anyone can make a smartphone, why are they making a smartphone? Sure, the rivals don’t outsell the big players, but they don’t need to. For almost any price, control your inventory and demand and you control your profitability.

Black days for BlackBerry

You’ll notice BlackBerry’s figure, where its costs are so mad that it’s effectively losing enormous amounts on each device it sells. Chief executive John Chen may say handsets are “profitable”, but that’s gross margin, before you take away distribution, administration, sales, and R+D. In day-to-day terms, BlackBerry’s hardware division is a mess, and I don’t see why Chen doesn’t say “we’re going to go into a maintenance mode where we supply legacy handsets to existing clients on demand” and simply focus on the software/services business for profit. The BlackBerry Priv would have to be a colossal hit to make up this ground, and there is simply no sign of that happening. Richard Windsor agrees:

The new BlackBerry Priv and its rumoured successors are aimed at such a narrow niche that I doubt that they will ever make money. Once this realisation has sunk in, I think that BlackBerry will abandon its hardware business and focus on its software business which has recently been bolstered with the acquisition of Good Technology.

The iPhone pricing puzzle and the single spec that matters

How much longer can Apple keep on with its premium pricing? This question has been asked pretty much since the first Macintosh was launched. The answer from the PC market seems to be “a lot longer than you might expect”. In the smartphone market, the distance between the iPhone ASP and the average Android handset ASP, even on these public figures, is $450, which is itself double the price of the average Android ASP. And it’s unlikely that the missing Android data covers handsets with higher prices.

This seems like a situation that can’t last, and yet we’ve seen in the PC market that it can and does: Apple’s ASP there is over $1,200, while that of the big five Windows PC makers wobbles around $500. Apple also makes about twice the operating profit on PCs as HP, Lenovo, Asus and Acer combined.

Yet in a space where prices of phones are dropping precipitously, the iPhone’s price tag seems more and more anomalous. Yet by standing outside those price wars, and by incrementally improving its offering again and again, it keeps pulling it off. In part, that’s because of the price: as CCS Insight noted in April,

Apple’s success in opening up new, high-growth markets such as China, India and Indonesia is significant. Although its products are out of reach for many people, the iPhone is widely regarded as a badge of success in these countries and there are still enough buyers who are affluent enough to afford one.

In that sense, the price is a spec – one where rivals are actually being degraded. It sounds completely contrary, but to a number of people an iPhone is an affordable luxury. Think of it like a car: some people really want Porsches. But if you could buy a Porsche for the same price as any other car, would it still have that cachet?

Maturity and change

We’re now moving into a situation where the biggest markets – China and the US – are approaching saturation, so that it becomes increasingly hard to persuade the remaining featurephone owners to trade up, and people are less willing to buy a new device just because it’s new. That CCS Insight forecast in April also says that smartphone sales in western Europe and North America will peak in 2017; but it also expects Apple’s share to grow.

Again, this seems contrary – won’t that just lead to people being driven by price? But in a mature market, you can get a move towards perceived quality and luxury, because you’re in a situation of plenty. As I showed using Ericsson’s data from mature markets, Apple can gain users in that situation, creaming them off from Android (and to a less extent from Windows Phone).

Conclusion: segue to VR

Three months or so back I wrote about “premium Android” hitting the wall. Now it’s sliding down, and being swallowed by dark matter and eaten by piranhas. So what keeps the lossmaking companies in the business? I think it’s pretty evident that they now have their eyes on the future: virtual reality. It’s a hugely promising technology which demands integrated systems with gyroscopes and, moreover, super-high-quality screens where you can’t discern pixels even if it’s a few inches from your face. That’s what Sony, LG, HTC and Samsung are all aiming at; each has its own offering in VR, while Apple hasn’t so far made a move.

Perhaps, though, history is going to repeat itself here. Each of those companies was strong in phones before Apple came onto the scene with the iPhone. It cannot have escaped Apple’s notice that VR is a promising market, with lots of applications. And it has been granted patents in that space.

Maybe in a few years’ time, we’ll be scoring profits in the VR market. For now, though, it’s all about smartphones – and there are still only two clear winners.

More articles to read:
BlackBerry might have no BB7 users left by February 2016
Premium Android hits the wall: the Q2 2015 smartphone scorecard
Google’s growing problem: 50% of people do zero searches per day on mobile
The adblocking revolution, and iOS 9

Android, iOS and Ericsson’s new leaky bucket meet the featurephone swamp


“You sell those Apple-Google-Samsung phones here?” Photo by rante_to4ak on Flickr.

Amid the tedious rows that punctuate the smartphone landscape, a recurrent cause of outraged comments is the idea of “switching”: that people might actually move from one smartphone platform to another, and do it of their own volition, and to a platform that is different from the one the commenter uses.

This tends to be seen not as an interesting insight into consumer behaviour, but instead as some sort of outright offence. That in itself is quite telling: it shows how personal our smartphones are. Insult (or leave) my smartphone platform, insult me.

That said, study after study tends to suggest the same thing: as a smartphone platform, Android is a “leaky bucket”: people join, but they leave too. By contrast, the iPhone is more of a roach motel (or Hotel California, if you prefer): people join, and they tend to stay.

There are plenty of examples of earlier studies that suggested this. Here’s an August 2013 piece I did on the “leaky bucket” prediction by Yankee Group, which has some supporting data from CIRP, and another from January 2014 by a UK company called Foolproof. Note how a lot of the comments say it’s nonsense because, well, it just must be.

Now there’s a new switching study, embedded in Ericsson’s Mobility Report for Q3 2015. You have to scroll down a fair way to find it (it’s on page 28/9), but it’s summed up in two graphics, where it splits the movement between the three mobile ecosystems into a “before a new iPhone launch” and “after a new iPhone launch”. Here’s “before”:

Ericsson: switching behaviour before iPhone  launch

And “after”:

Ericsson: platform loyalty after iPhone launch

Note the caveat of where the data comes from:

“This analysis is based on measurements before and after the launch of new iOS smartphone models in a selected number of mature mobile broadband networks in Europe, Asia and North America. The study encompassed iOS, Android and Windows devices. Other operating systems like BlackBerry, Symbian and FirefoxOS had very low penetration in all measured networks and therefore were not included.”

“Mature markets” probably means the US, Canada, some or most of the “big five” in Europe (UK, Germany, France, Spain, Italy) and perhaps a couple of others, plus Japan, China and perhaps South Korea.

So those who want to disagree with this data will already be saying “bah, mature markets”.

The mature approach

That overlooks the fact though that all markets for a product eventually become mature markets. Ericsson is giving us a glimpse of the future.

What the data says is quite informative. A few quick takeaways:
• in a “before” month, 6.3% of people buy a new phone – though only 2.87% (45% of them) change platforms
• in an “after” month, 10.3% buy a new phone – with 3.4% (33%) of them changing platforms. (Nearly half of those buying a new phone are iPhone owners.)
• nobody, by this data, ever changes from an iPhone to Windows. Yes, yes, I know your second aunt’s cousin who works in IT did, but we’re talking here about scale – across millions of users. 0.01% of a million equates to 100 people. Apparently not even at that scale does this happen enough to register.
• on the 6.3% and 10.3% turnover rate, everyone replaces their phone somewhere between 10 and 16 months.
• Windows Phone users seem to be the busiest in buying phones.

I thought it would be interesting to model how this changes the user base if it’s repeated over time. Note that Ericsson is suggesting it’s only a snapshot for a few weeks, and only for people who get a new phone and stay on the same carrier. (But the latter is true of most people.) If this is how things play out, perhaps we can learn something. So I put the data into a spreadsheet, and set up the algorithm to step through month by month according to the Ericsson platform change stats. So from 10,000 Android users, in a “before” month you’d get 30 going to iOS and 7 to Windows Phone (see the diagram above). And so on.

My spreadsheet is here. I used the 1.4bn figure for the Android base, 400m for the iPhone, and 80m for Windows Phone – about the total number of Lumias sold since their inception. (The extra 0.1 that appears over time is due to imprecision in the calculation – each “before” month adds 0.01 to the figure.)

The graph doesn’t show much perceptible change:

Modelling platform change from Ericsson data

Note that this assumes 15 months with only one iPhone launch.

Note that this is over 16 months, but with only one iPhone “launch” right at the start (whose effects then carry on for four months) – so you can see that the iPhone launch doesn’t make a big difference to the general trend.

Equally, you can also see that there isn’t a huge amount of movement. The iPhone chunk gets wider: in this example, with a four-month “after launch” period and eight-month “before launch” period, by the end of the 12th month
• the iPhone has gained 51.9m users
• Android has lost 40.1m
• Windows Phone has lost 11.8m.

In percentage terms, it’s pretty unimportant to Android – 2.9% loss – but big for iPhone (+13.0%) and bigger for Windows Phone (-14.8%).

If you change to a 12-month “before launch” year, the changes are -25.1m for Android (1.8% change), +31.1m for iPhone (+7.2%), and -5.9m for Windows Phone (8.2%).

You can quibble with the starting figures. Playing around with them, I found the following properties:
• the larger the initial figure for Android, the larger its final fall (obvious) but also the larger its percentage fall
• the larger the initial figure for iOS, the smaller the absolute and percentage growth
• iOS is the only platform to show overall growth on any combination of the “before launch”/”after launch” model.

The featurephone swamp

In which case, you might ask, howcome Android’s installed base is still growing? Simple: there’s still a huge base of featurephone owners who are being converted upwards to smartphones. They’re easy to overlook, but key to this dynamic.

For instance, in the Yankee Group study from August 2013 quoted above, the key mistake that it made in forecasting that iPhone use would overtake Android use by 2014 was to overlook the continuing source of new Android users – from featurephone owners moving to smartphones. In August 2013, there were 90m of them, according to ComScore; the latest figure, from September 2015, says there are still 56.2m of them (so 33.8m fewer).

In that period,
•the number of US iPhone users has grown from 59.0m to 84.3m (up 25.3m);
• the number of Android users has grown from 74.8m to 98.8m (up 24m).

There’s hardly a dramatic difference in growth between Android and the iPhone (contrary to what Forrester expected). You wonder where the other net users came from besides featurephones? The fall in BlackBerry users (5.8m to 2.3m). In the same period, Windows Phone users barely grew (4.6m to 5.5m). And there are 12m extra featurephone users in September 2015 compared to August 2013 making up the gap.

As for Windows Phone: if Ericsson’s numbers say it’s losing users, the obvious question is: how did it get to 80m (or so) users in the first place? The easy answer: Ericsson’s diagrams don’t show the pipeline bringing users into Windows Phone from featurephones – usually via the Lumia 5xx low-end range.

The eternal puzzle of iPhone growth

Even allowing for that, it’s notable that the ComScore data says that in the US iPhone users have grown more (both in percentage and sheer numbers) than Android users. Sure, home distortions and all that. But why is that the case in the other mature markets too? Why is iPhone ownership growing in other places, and why don’t they leave?

It’s this last point which befuddles and almost infuriates people. Why on earth, they say, do people buy iPhones, which only have a dual-core CPU with 2GB of RAM running at 1.8GHz and without an SD card slot, when for less money they can get an octacore phone running at 2.6GHz with 4GB of RAM, an SD card slot, removable battery and a QuadHD screen? You can hear the puzzlement in comments from people who can read a spec list, yet can’t see why the inertial scroll on the iPhone is a more pleasing experience than the rolling velcro on even top-end Android phones. (I keep going and checking the scrolling on each new Android phone. Still isn’t smooth. Clearly 2012’s Project Butter still needs to be supplanted by Project Ghee.)

There’s more than that, though. I don’t think anyone buys an iPhone by accident. I don’t think people walk into a store not intending to buy an iPhone and then find themselves surprised to be holding one as they walk out.

Whereas choosing between Android phones can be like a beauty contest of clones. You put various models of Samsung phone against LG phones against the slightly harder edges of the Sony against the iPhone-alikeness of the HTC models, and you try to pick. How do you choose? Probably on some subtle mixture of the price tag, tickboxes and comparative sizes of numbers on the spec list and.. that’s probably about it.

You can argue (and oh my giddy aunt people do) about why people buy iPhones. I’d say there’s clearly a perception among those who do that they’re getting something premium. The price tag alone suggests that.

That isn’t enough however to keep people on a platform if the experience didn’t also work for them. Do some people migrate from Android to iPhone, and then migrate back? Undoubtedly. But the data suggests most who make the shift don’t.

Is your argument that people get “locked in to the Apple ecosystem”? Perhaps. But it’s not just on iOS, as this comment from an article about Android Wear demonstrates:

Comment on Android Wear

Note the nose-spiting-face nature of the first one..

On that basis, people should be just as reluctant to move to iOS as away from it. Again, the evidence disagrees.

I think there’s a frustration factor driving some movement too; I watched the friend of a relative struggle to get the maps on her Sony phone work recently. First to find the apps, then to find the maps app, then to get any sensible input, then to get sensible output. (Since you ask, she’s one of the country’s leading barristers.)

I couldn’t help but wonder if she would have found it simpler to have a Maps icon front and centre. Apple’s reputation for simplicity is actually a selling point for such users, even if it isn’t for the gigahertz-SD-RAM-removable battery crowd.

Feeling it

Conveniently, just as I was writing this piece, Ben Thompson wrote a piece on Stratechery about “Selling feelings“, with this notable point:

how silly must you be to carry a $5,000 handbag with far less functionality than another a fraction of the price, or wear a $10,000 watch or $200 necktie? What about flying first class or staying in a five-star hotel — you can’t take either with you! It’s completely irrational.

Or, rather, it’s irrational if you only look at features. The entire point is how these purchases make you feel, and it’s that feeling, whether it be an appreciation for craftsmanship, status, or simply being pampered, that provides the sort of differentiation that makes all of these products profitable. One could argue that an insistence on limiting the calculation of value to items that are permanent, physical, and easily listed on a spreadsheet is the real irrationality.

There’s no shortage of that latter group who’ll tell you that the iPhone is rubbish. Meanwhile, continuing evidence from a growing number of studies says that over time, the iPhone base continues to grow. The question is, once the swamp of featurephone users is drained, what happens over the longer term?

TEDx Hilversum: “How to spot the next big thing” – slides and commentary from my talk

I spoke at the first TEDx in Hilversum, Holland

There was a “selfie booth”, appropriately enough.

I was invited to talk at the inaugural TEDx Hilversum – the Dutch city which is the country’s medialand, and whence the TV format ideas both for “Big Brother” and “The Voice” came.

The topic: “How to spot the next big thing”, building on a column I wrote for The Guardian’s Tech Monthly supplement back in October, about how the selfie was pretty much accidental.

What I wanted to explore and expand on in the talk was how these “next big things” in social interaction happen, and where you’d look to find the next one. (This isn’t a transcript – it’s the ideas I spoke on. The talk is about 15 minutes. I’ll put up the link when it’s available.)

Spotting the next big thing

How to spot the next big thing
Photo by c@rljones

This isn’t, therefore, about which startup you should put your money into, though it might give you hints about what sort of things could generate money – if you’re ahead of the game.

Three characteristics

Three characteristics of a 'next big thing'
Photo by Japanexperterna.se

Three characteristics of “next big things”: they’re about kids and teens experimenting; adults find them a bit silly (or impossible or embarrassing); and they don’t require anything extra, because they’re immanent to the device.

Only mobile matters

Mobile is the only platform that matters
Photo by Kris Krug

When we’re looking for the “next big thing”, the only place to bother looking is mobile. It’s the only platform that matters. People might say “what about the PC? There are 1.5 billion of them installed around the world.” Nope.

Think about this: what was the last important app that launched first on the desktop (not in the browser, because browsers work on mobile too)? There were two – Spotify and Dropbox, which both launched around the autumn of 2009. Everything big since then – Instagram, Snapchat, Whatsapp, Uber – has launched first and pretty much only on mobile, with essentially no functionality on the desktop.

By contrast, everyone has a mobile phone – there are more than 2 billion smartphones in use today. Pretty soon everyone will have a smartphone. Look at the people in the picture above: they’re holding up their mobile phones, not their laptops.

The first big thing

The first big thing on mobile: texting
Photo by larskflem

The first big thing was text messaging, aka SMS. Invented in 1986 and implemented in 1992, it didn’t take off at first – until the advent of pay-as-you-go (PAYG or pre-pay) phones, which meant that they were cheaper and adults didn’t have to commit to a contract for their kids; they’d just use what they needed. And those kids discovered SMS was cheap, and fast, and personal, and they loved it. The explosion in PAYG phones, in the UK at least, happened in 1999.

Watch SMS grow

How SMS use grew globally
Here’s how SMS use grew globally. There’s almost exponential growth right up to 2011; and then it peaks in 2011-2012 and has fallen off since.

Why the falloff? Because the people who had been kids in 1999 were 12-13 years older. They’re grown up, having their own kids. Meanwhile the other kids growing up in the intervening years were moving on to their own things – OTT services using data, such as BBM, iMessage and Whatsapp. SMS was a golden goose for the carriers; now it’s being killed off. Whatsapp has only been available for five years – founded in 2009 and first released in 2010 – yet it’s now bigger than SMS in volume.

Me, my selfie, I

The source of 'selfie'
Sure, we know that there have been “selfies” for ages – painters in the Renaissance doing self-portraits, even Buzz Aldrin doing one in space during an Apollo mission in 1966. But we didn’t call it that, and “selfie” has a particular meaning in our context: pictures taken with our mobile phones, generally using the front-facing camera.

Watch ‘selfie’ grow

Photos tagged 'selfie' on Flickr, 2000-2005
I thought this 2002 origin was interesting, so I dug out data from Flickr, looking for photos tagged “selfie” by year (1 January-31 December for the respective years). There’s that first 2002 use highlighted for reference, and clearly lots of millennium-dated photos that were backloaded; Flickr didn’t even exist until 2004. Yahoo bought it in 2005, and things started growing.

..and grow

Photos tagged 'selfie' on Flickr, 2000-2012
Fast forward to 2012, and the number is exploding.

..and peak?

Photos tagged 'selfie' on Flickr, 2000-2015
Fast forward again, and this really looks like exponential growth. Though the 2015 figure – with my estimate for the final total – looks like growth has slowed substantially. Why’s that? We’ll come to that in a moment.

Trending searches

Google search trends for 'selfie'
Just for contrast, here are the Google search trends for “selfie”. Pretty much nothing until 2013, when it takes off. (Think of the selfie at the Mandela funeral by Obama and the Danish prime minister in December 2013, which is the first peak there, and the Oscars selfie by Ellen DeGeneres – actually taken by Bradley Cooper in March 2014 – which marks the high point.) But it looks as though interest in the selfie is dying, doesn’t it?

Peak selfie?

Google trends and Flickr trends for 'selfie'
If you superimpose the Google Trends data and the Flickr data, their growth looks pretty similar. So is the selfie dying off?

What’s more probably happening here is that a new generation of kids isn’t using Flickr – they’re on Instagram, where millions of selfies are posted every day. I couldn’t extract the data from Instagram, but you can be sure it’s huge. The selfie has probably got a few years left in it yet. But that generational shift is interesting, because it’s just what we saw with SMS before.

Next to arrive

Two big things; what might be a third?
So there are two examples so far of “next big things”. What might be next?

Well, the smartphone is the most personal device ever. It knows who we know, when they call, when we ignore them, what we like and what we watch, what we read, how we communicate, where we go.

Why wouldn’t it be used for… sex?

Call me maybe

Tinder's three-screen explanation
Turns out, it already is. Apps like Tinder fit all of our three criteria: it’s used by the young, it puzzles the old (“why would you judge someone based on so little information?”), and it uses qualities inherent to the device – selfies for profiles, real-time data updates, touch interaction, geolocation.

Tinder alone sees billions of “swipes” on profiles every day, and millions of meetups, and there are surely going to be Tinder babies – people created on the basis of algorithms on smartphones. Is that weird, or just natural? Your view might depend on your age.

A new search

It's in our phone, but what is it?
After SMS, selfies, sex, what will the next big thing look like? There are some clues. The biggest one is that it’s almost surely already in the phone, just as SMS was a capability in 1992, before PAYG phones, and selfies were possible from the first phones with a front-facing camera in 2003.

So here are three elements that I think might feed into the next big thing.

Three potential elements

The capability is there, and growing
Deep dream: photo by kevin dooley
Google Cardboard: photo by juan tan kwon

Artificial intelligence: The first, and biggest, is artificial intelligence or “machine learning”. This is a picture of someone as visualised through Google’s “Deep Dream” neural network. We don’t understand it because the machine refracts its view. But to the machine, it makes a sort of sense. There is a growing amount of AI/ML/NN technology in all our smartphones: Apple’s Siri, Google Now, Microsoft’s Cortana. You can also get “assistants” such as Amy (which will set up meetings) and “Charlie” (which will give you a social media profile of people you’re going to meet).

This AI tells us if we should leave early for meetings, who’s calling us (perhaps based only on phone numbers found in emails, not our contacts), what apps we look at, what news we look at, how we interact with the world through our phone. In the next few years, we should expect that it will become far more powerful, even without a connection to the cloud; if you think that sounds fanciful, just go back five years, to 2010, and none of the phones we have had those sorts of capabilities. Siri hadn’t been introduced. Think five years ahead, and that’s the sort of gap between now and then that we’re going to see.

Health/fitness: if my AI knows what I’ve been doing, shouldn’t it also know how well I’m doing? Connected to devices such as a watch or fitness band, there’s far more data about ourselves becoming available. Does that feed into the Next Big Thing by showing that you’re *really* fit in your online dating profile? Does your AI tell you before you’re going to be ill?

Virtual reality: This is Google Cardboard, a super-low-cost implementation of virtual reality: you cut and paste it together from a kit, and then slot your smartphone into the gap, and bingo. It’s on the tipping point, I think; ready to take off. And when that happens, everything becomes possible. What if the Tinder profile of the future lets you walk around the person you’re interested in dating, in 3D? What if you meet without physically being in the same place?

Conclusion

I don’t know what the Next Big Thing actually is. But consider a couple of points. SMS was invented over a decade before it actually took off. The word “selfie” was coined for the activity back in 2002 – yet it only exploded into public consciousness a decade later.

Perhaps the word for the next big thing has already been coined; it’s been tossed around carelessly on an online forum where someone is describing something they did or something that happened. And in years to come we’ll look back and say ah, it was obvious.

That’s because spotting the next big thing is a puzzle, not a mystery. There’s a difference between the two. A mystery is – well, think of a murder mystery. Only one person knows who did it, and they’re not saying. Mysteries are meant to remain unsolved.

But to understand a puzzle, think of a jigsaw puzzle. The pieces are all there, in plain view; the only problem is putting them together correctly.

For entrepreneurs, there is good news: if you’re alert, you can cash in. SMS made huge profits for carriers. Selfie sticks meanwhile have been nice business for some factories in Shenzhen. (They’ve even led to museums changing rules; that’s success, when you change society, even a little.)

Just as puzzles just need the pieces put together correctly, it’s very likely that everything necessary for the next big thing is right there, just waiting for someone to put it together. The people who do that probably won’t be the adults; it’ll be the kids and teens messing around. And adults will probably think it’s stupid. But that’s how it goes.

Still, we won’t have to look far to find it. It’ll be right there in the palm of our hands – in our phones.