
Apple released its fiscal fourth-quarter results (calendar third quarter) to the end of September on Thursday. So following up on my post from earlier this week, here’s what the data tells us about that period – which already feels like it’s in the rear-view mirror, what with the iPhone XR and new iPads and Macs having been launched just in the past couple of days, mid-quarter.
But analysing the effects of those is going to be more difficult than this: Apple announced that it’s no longer going to provide unit sales data. We’ll only have revenues for iPhones, iPads and Macs. This is being interpreted as an attempt to hide bad news that’s surely on the way for unit sales; Apple isn’t happy about this interpretation, and insists that its user base is growing, and that a focus on unit sales – the horse race – distracts from what’s really going on. It wants people to look at the growth in (high-margin? We’ll find out because it will reveal, next quarter) areas such as Services.
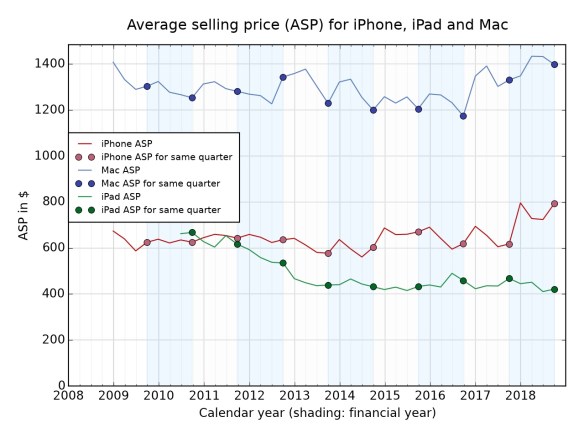
Anyway! On with the graphs. First, average selling prices (ASPs). Shed a tear, it’s the last time we’ll be able to do them like this.
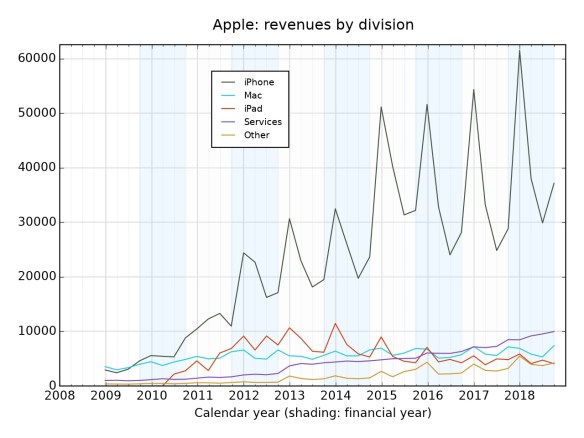
Next, the divisional revenues. Note how Services is definitely the second-biggest.
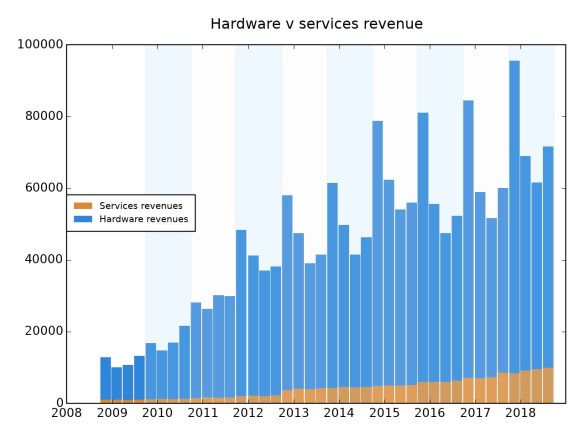
And let’s see the hardware v services breakdown more clearly in the next two graphs. First, just broken out.
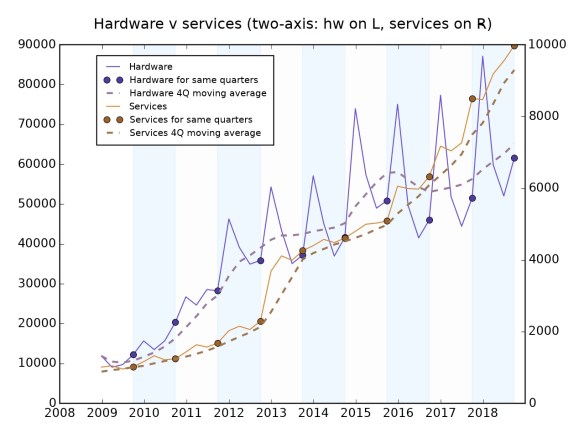
And now – apologies for its slight lack of clarity – the growth in Hardware (on the left axis, in purple) v Services (on the right, in brown). Services is growing faster than Hardware.
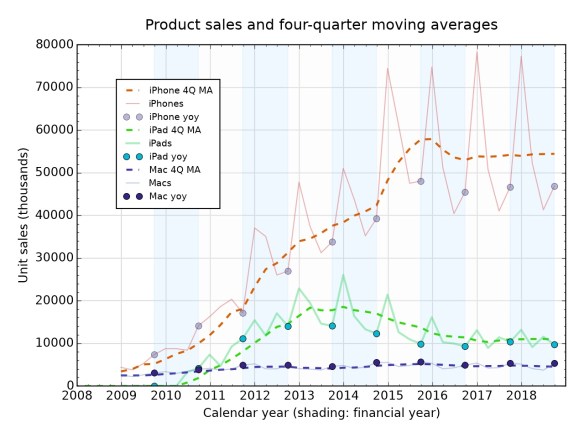
Now: the overall picture of products sales. Again, we’re not going to be able to do this again, so feast your eyes. And look at how FLAT everything is. Unit sales growth has stopped for the past two years.
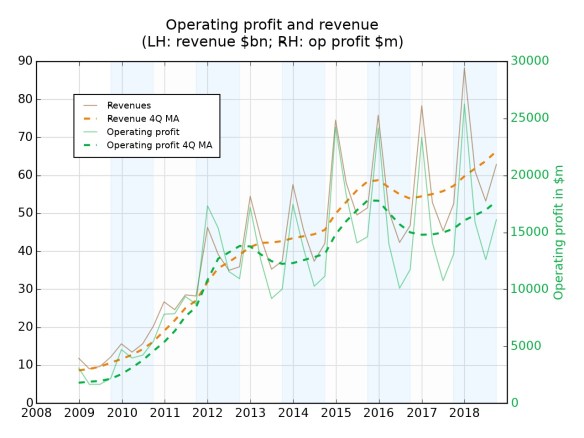
And next we have operating profit (green) and revenue (orangey). The gap is actually growing: Services seems to be less profitable than Hardware, as we knew. But both still trending up.
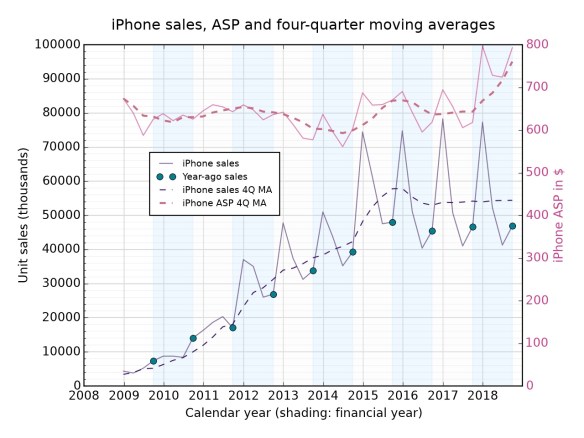
Now some more detail on the iPhone. Look at that uptick in ASP! And look at how flat sales are on the 4Q moving average. The growth has gone out of the market overall; global smartphone sales were actually down 6% in this period, so Apple actually grew its share by standing still.
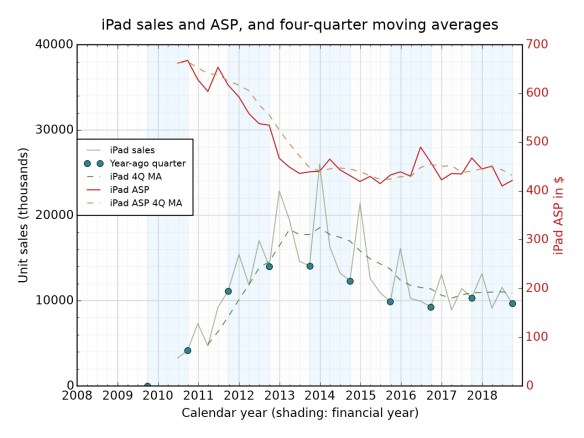
The iPads too: Apple owns the tablet market, but the tablet market is well past its peak.
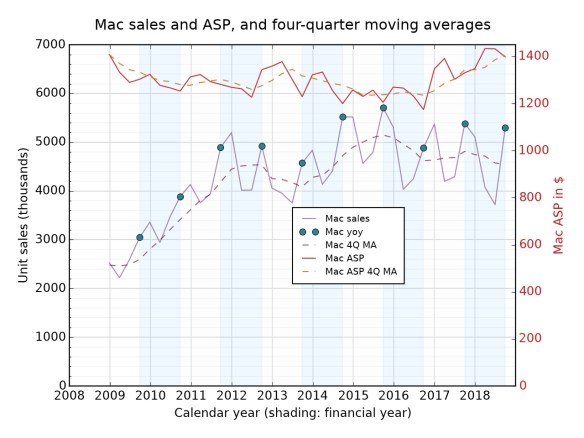
How about Macs? Sales are once more flat (the line with dots), ASPs are up. That ASP line will probably go up next quarter – though we won’t know exactly how much.
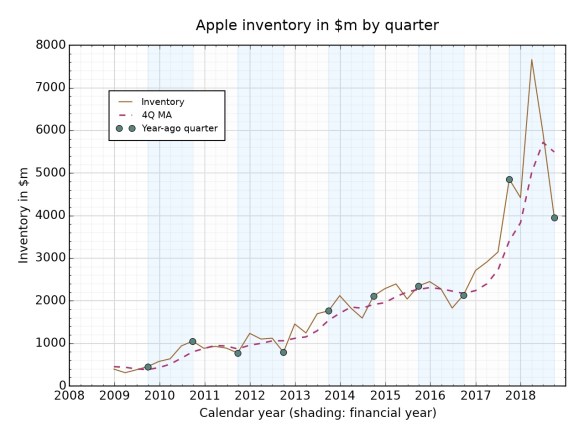
Now to the graphs which tell us how the machine is working: inventory and R+D. You’d expect that inventory would build ahead of a big launch, and then fall, and so it proves. Even so, it’s big…
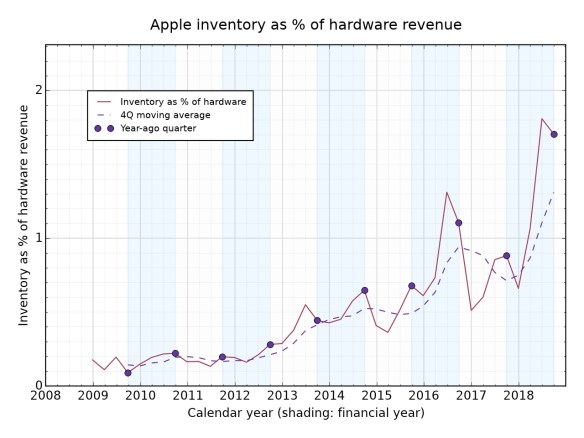
But if you look at it as a percentage of hardware revenue, inventory is really high. REALLY high. Heading up to 2%, which implies lots of things sitting in warehouses. I’ve had a look at Apple’s filings, and it doesn’t break down inventories into raw goods/work-in-progress/finished, so we can’t know if that’s self-driving cars being built or the iPhone XR (then unreleased) sitting in Chinese factories. Probably the latter, mostly.
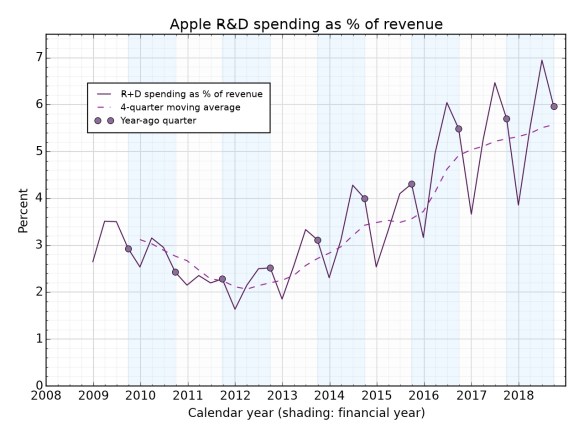
As to the future: research and development spending. Look, it’s up!
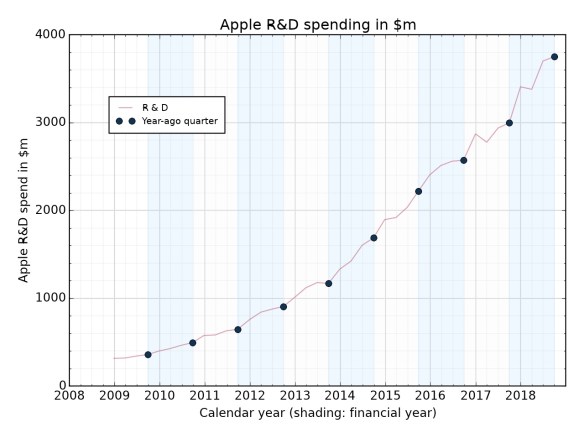
And as a percentage of revenue, it’s also at a historic high. This either balances out the inventory stuff, or is somehow caused by it.
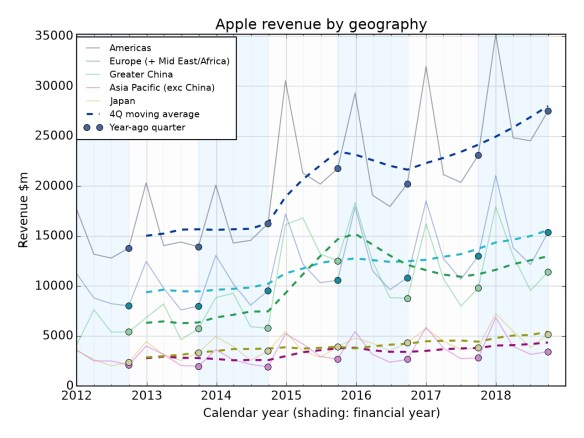
Finally, the geographical breakdown. The Americas (particularly the US) is driving this, but notice how things are slower in China and the rest of Asia. Europe generates more revenue than China; there’s no sign of that changing in a hurry. Apple’s hope that China would become its No.2 source of revenue seems to have been dashed.
And that’s it! Comments welcome, including suggestions for the colours. I may redraw these so that the lines are more clearly labelled, but will leave the text alone.

I can understand Apple’s point in no longer releasing unit counts: if the revenue per device and the longevity of devices are rising, unit sales are no longer that relevant since they’re decorelating from revenue and profits.
But, and that’s a big but, almost all Apple business is dependent on iPhones sales: nobody ever bought an Apple service or peripheral/cable, and many people buy a Mac, because they have an iPhone. Those are all ancillary sales, so iPhone unit sales and installed base are crucial.
dang split negative, worse than split infinitve. I’ll let the reader autocorrect ;-p
“Apple owns the tablet market, but the tablet market is well past its peak.”
Can we stop with that lie ? Apple represents less than 30% of the tablet market. Maybe they own the profit and your bubble, they certainly don’t own the market with less than half of Android’s share. https://www.statista.com/statistics/273268/worldwide-tablet-sales-by-operating-system-since-2nd-quarter-2010/
What’s interesting is the very low ASP for tablets, pointing at very strong sales of the $330 iPad. Might explain why Apple is rising prices on iPhones so much: dumbest explanation is that people are interested in, and locked-in, the ecosystem more than the devices, so Apple must drive prices higher. That’s risky though, around me, out of maybe 40 people I have that info on, 4 switched away from Apple because prices and overserving.
“Owns the tablet market” in the sense of extracts the vast majority of the profit. Android OEMs are exiting the tablet market in a hurry: they can’t make a profit and volumes are falling. If you look at the IDC data, you find that many of the names that used to feature prominently – Acer, Asus – have vanished. “Others” (ie not the top 4 Android tablet companies, which now includes Amazon – a forked Android) are more than 50% of the Android tablet market, and you can bet there’s a ton of no-name horrors in there.
At some point, it’s important to stop focussing on absolute numbers and consider whether the platform is sustainable. Android tablets aren’t unless you have something else going on. Amazon: does. Samsung: does (good way to keep showcasing its screens and its other software/services offerings). Others: don’t.
Yes, the lowest-price iPad is clearly doing ok – might be education purchases, might be iPad 2s finally getting replaced.
Your info on your group is interesting, but is of course anecdata.. and you might be ignoring people who have switched the other way, or will do with the XR. In general, once you’ve got a phone, of whatever ecosystem, it’s not expensive to keep owning. What costs is changing. Changing ecosystem in either direction is doubly expensive because you have to set up new behaviours/apps and learn new ones.
I’d be interested in Marcom expenditure too if that’s available, including rebates. It seems at times Apple is doing a lot more sales than they used to, punctually, and that was a while back.
I’ve never seen any data on marcoms (marketing and communications). There’s “sales and marketing” and there are various details in the 10K/10Q about warranties. You could have a look yourself tho.
Pingback: Результаты четвертого квартала Apple | alexmak.net
With a bit more time to think on it, 2 things seem missing, and what’s unsaid often says more than what’s said:
1- Where’s that supercycle that was the rabbit in the hat 1-2 yrs ago ? Still delayed, or cancelled ?
2- Did Apple say anything about switchers and new users for iPhones ? They used to ?
It was the analysts who talked about the supercycle; maybe that’s due this year, maybe not. The whole smartphone market is slowing down, so static sales *is* bigger sales in that context.
Don’t know about switchers but they did say user base is growing, I think. Part of why they’re removing unit sales numbers – because they say that obscures focus on growing user base. (Which perhaps is what the growing Services number points to.)
Pingback: Apple Latest Financial Results – The End of an Era – Numeric Citizen
Pingback: Michael Tsai - Blog - Apple’s Q4 2018 Results
Pingback: How to find out if you’re paying an App Store subscription without realising it – and what Apple needs to do | The Overspill: when there's more that I want to say
Pingback: The iPad Pro: when software delays meet ‘real work’ reviewers | The Overspill: when there's more that I want to say